Catch what your tests miss: observe and score your WEC app in production with Langfuse

 +
+- 1Prove a model works
- 2Trustworthy JSON
- 3Real test data at scale
- 4Observe & score production
- 5RAG, end to end
- 🏆Catch regressions in CI
A customer says your support bot promised them a refund policy that doesn't exist. Your feature made two LLM calls — classify, then reply. Which one invented it? If you can't answer that, your app is a black box — and this guide fixes exactly that.
You can now prove a model works (part 1), make its output machine-reliable (part 2), and generate a real test set to check it against (part 3). But all of that runs offline, in CI, on inputs you chose. Production doesn't play along.
This guide closes the gap. We'll self-host Langfuse — the open-source, self-hostable alternative to LangSmith — trace every real call, auto-score live traffic with an LLM judge, drill into the exact step that breaks, and feed failures back so your part-3 dataset gets stronger. Offline eval tells you it worked on your test set; this tells you it works in the wild.
The skill this adds
By the end you can take any WEC feature and: see inside every call, score quality on real traffic automatically, find the exact call that broke and why, and turn production failures into new test cases. That's the difference between "it passed CI" and "it's holding up in production."
We'll keep the running example from part 3 — a support-ticket classifier on the WEC Inference API — and put it under observation.
What we're building
Your app calls the WEC API as usual; Langfuse (self-hosted) quietly captures every call as a trace, an LLM judge scores each one, and the failures flow back into your part-3 dataset — so production keeps making your evals stronger:
Why Langfuse (and when to pick something lighter)
We use Langfuse because it's the open-source leader for LLM observability (MIT-licensed, self-hostable), its SDK is OpenAI-compatible so it points at the WEC API unchanged, and — the reason it fits this series — it has datasets, scoring, and LLM-as-judge evaluators built in. That's what lets your part-3 dataset and the "score production, feed failures back" loop be first-class instead of bolted on.
The trade-off: the production stack is heavy (Postgres + ClickHouse). If you don't need the eval features and want lighter, reasonable alternatives are Arize Phoenix (OpenTelemetry-native, strong for offline eval), Helicone (a one-line proxy — but no evals), or OpenLIT (single-binary, OTEL-native). For an eval-driven workflow like this one, the extra containers earn their keep; for plain tracing, one of those may suit you better.
Step 1 — Self-host Langfuse on a WEC Instance
Langfuse's self-host stack is six services (web + worker, ClickHouse, Postgres, Redis, object store), so give it a WEC Instance with ~15 GB disk and 4 GB+ RAM — don't cram it onto a box that's already busy.
git clone https://github.com/langfuse/langfuse.git && cd langfuse
Generate three secrets and drop them in a .env (the ENCRYPTION_KEY must be hex, or the
web container won't boot):
cat > .env <<EOF
NEXTAUTH_SECRET=$(openssl rand -base64 32)
SALT=$(openssl rand -base64 32)
ENCRYPTION_KEY=$(openssl rand -hex 32)
NEXTAUTH_URL=http://<your-instance-ip>:3000
EOF
docker compose up -d
docker compose ps
 Figure 1.
 docker compose ps — all six services (web, worker, ClickHouse, Postgres, Redis, MinIO) up and healthy.
If the box already runs something on port 3000 or 5432, Langfuse won't start ("address already
in use"). The backing databases don't need host ports at all — edit docker-compose.yml to move
langfuse-web to a free host port (e.g. 3001:3000) and drop the Postgres host mapping. Keeping
your databases off the host network is good practice anyway. See Troubleshooting.
Open http://<instance-ip>:3000, create an account (first user is the owner), then an
Organization → Project, and under Settings → API Keys create a key pair
(pk-lf-… / sk-lf-…).
Step 2 — Instrument the classifier so every call is traced
Point the Langfuse SDK at your instance and use its OpenAI drop-in — it auto-traces any OpenAI-compatible call, including the WEC Inference API, with zero extra code around each request:
python3 -m venv ~/lf-env && source ~/lf-env/bin/activate
pip install langfuse openai
export LANGFUSE_PUBLIC_KEY="pk-lf-…"
export LANGFUSE_SECRET_KEY="sk-lf-…"
export LANGFUSE_HOST="http://<instance-ip>:3000"   # use the port you exposed — 3001 if you remapped in Step 1
export WEC_API_KEY="sk-your-wec-key"
import os
from langfuse.openai import openai          # drop-in: auto-traces every call
from langfuse import get_client

client = openai.OpenAI(
    base_url="https://inference.wiline.com/v1",
    api_key=os.environ["WEC_API_KEY"],
    timeout=30,                             # ALWAYS set this — a slow backend hangs forever otherwise
)

def classify(ticket: str) -> str:
    resp = client.chat.completions.create(
        model="Qwen2.5-3B-Instruct",
        name="ticket-classify",             # names the trace in Langfuse
        messages=[{"role": "user", "content":
            "Classify this support ticket. Return ONLY JSON with keys "
            "category (billing/technical/account/other), priority (low/medium/high), "
            f"summary. Ticket: {ticket}"}],
    )
    return resp.choices[0].message.content

if __name__ == "__main__":
    print(classify("I was charged twice this month."))
    get_client().flush()                    # push traces before the process exits
Run it, then open Tracing — the call shows up in seconds with input, output, latency, token counts, and (once we add pricing) cost.
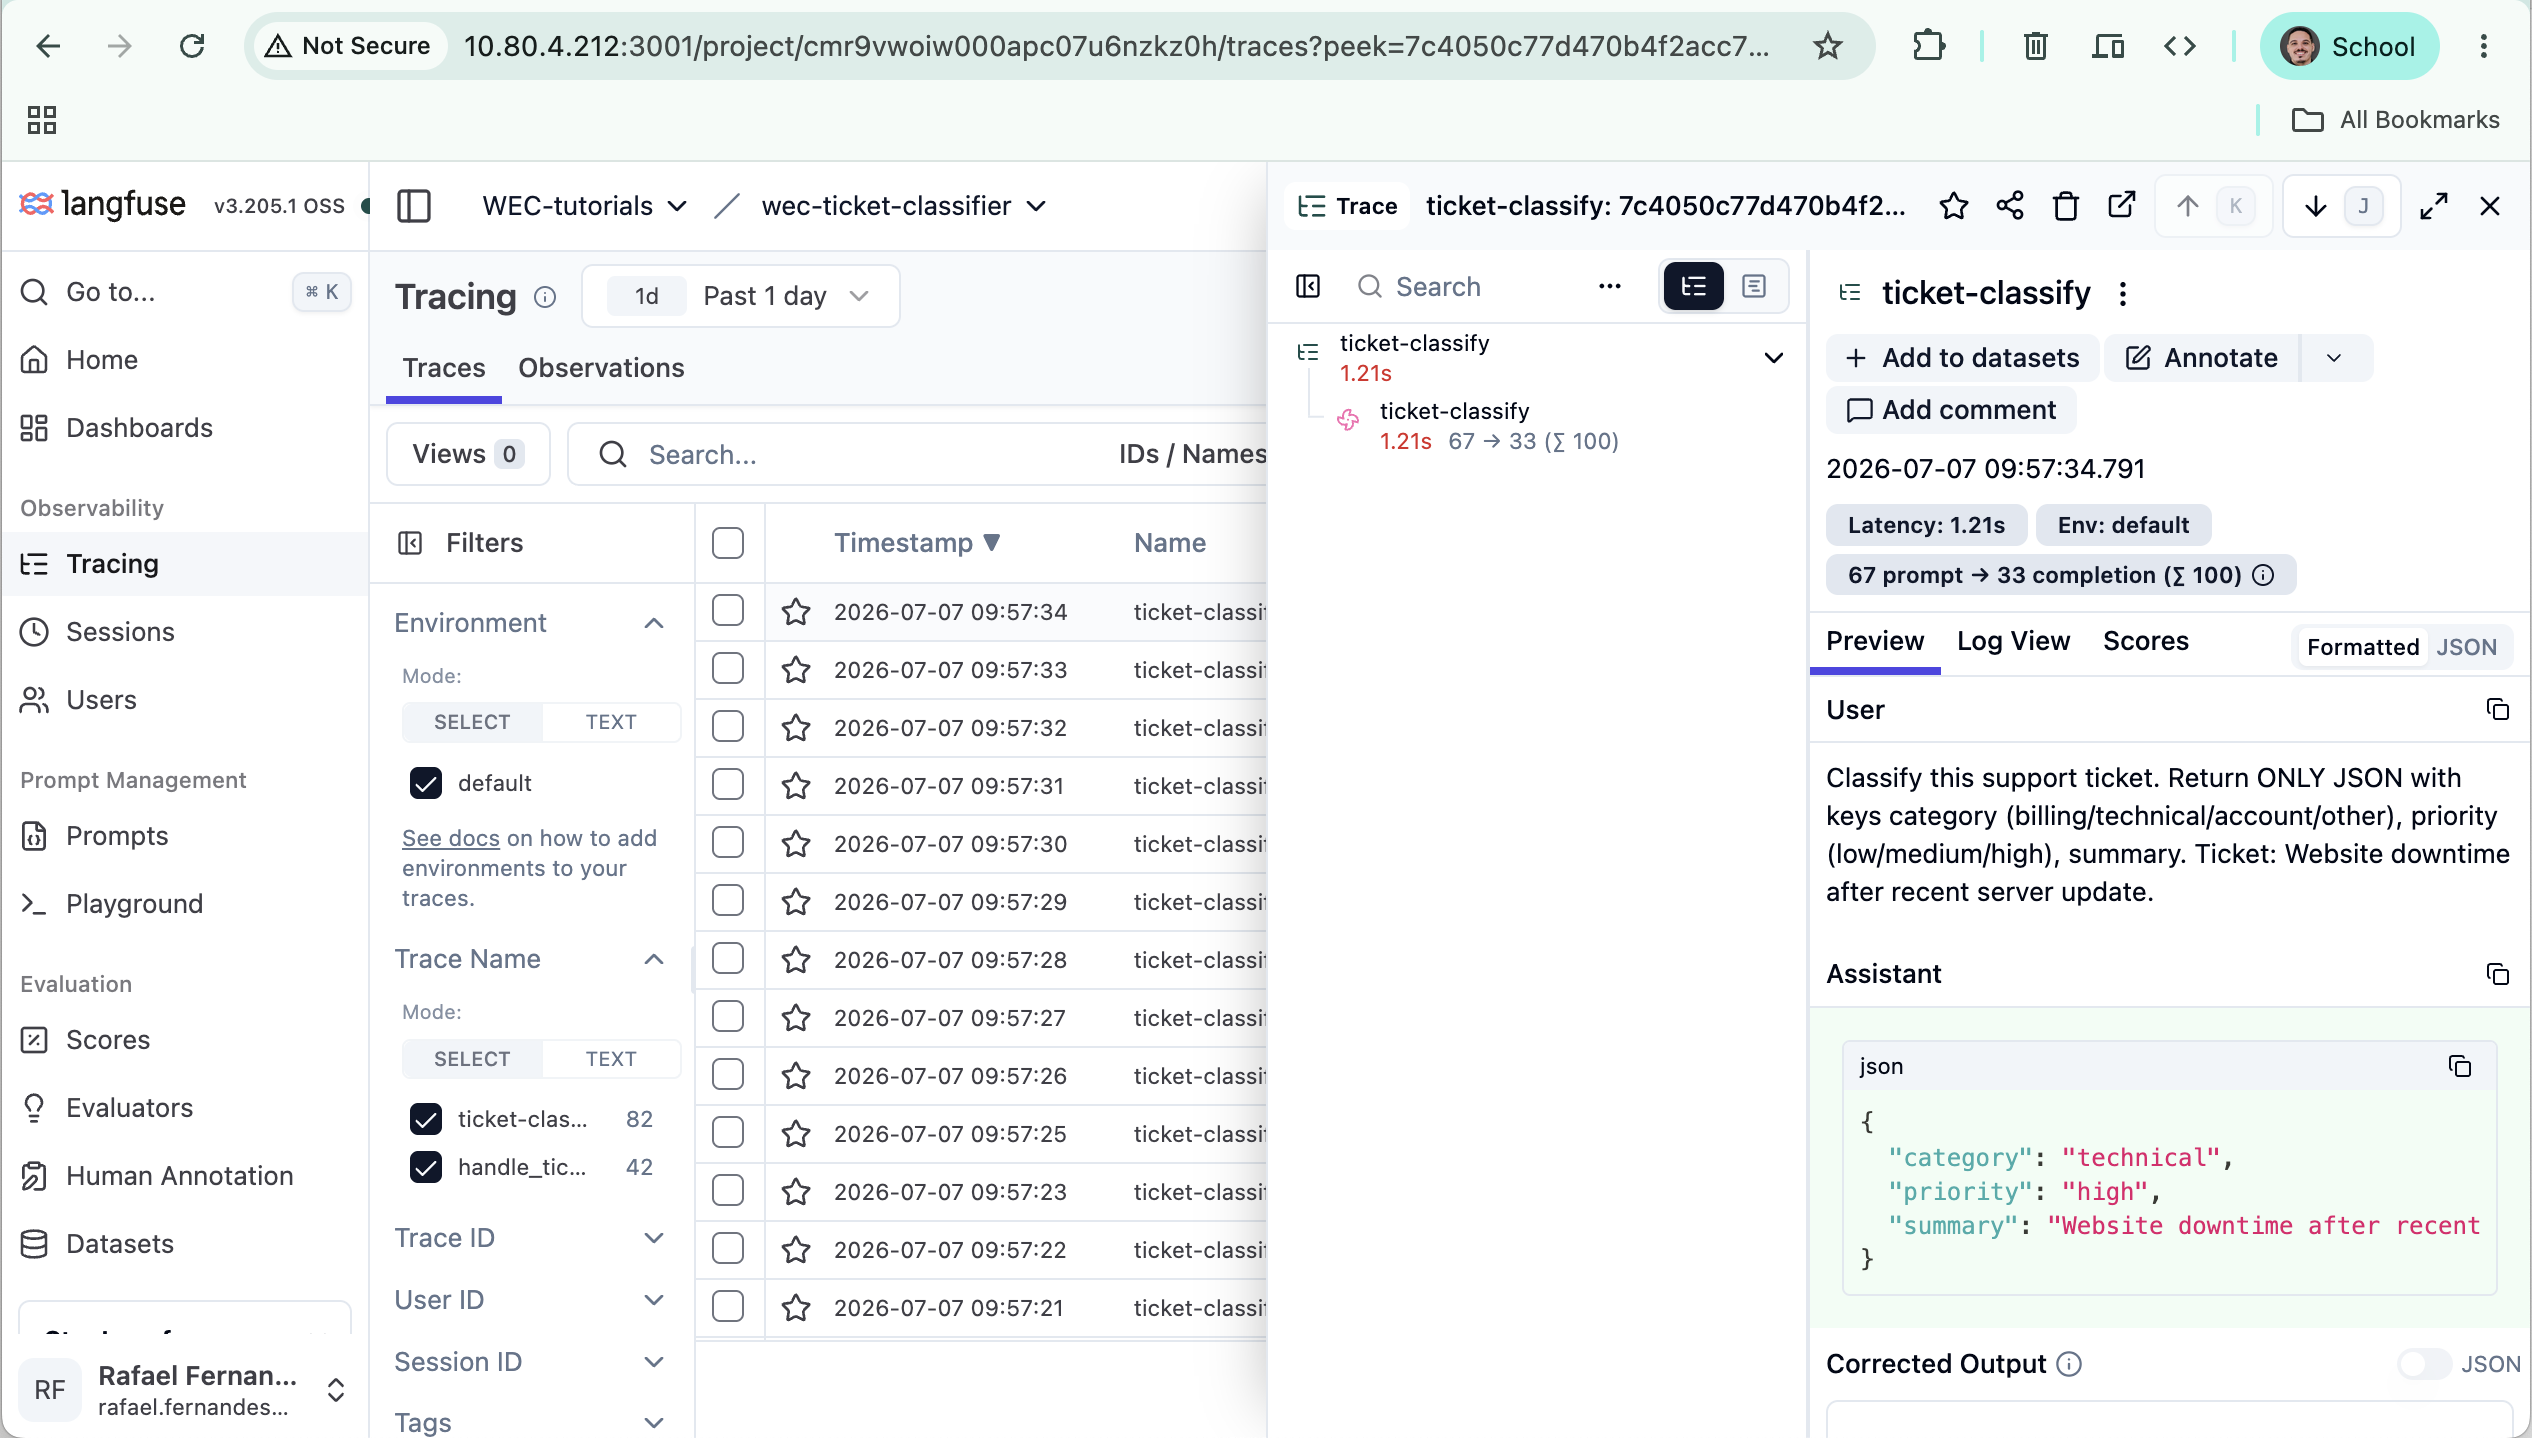 Figure 2. One
 ticket-classify call in Langfuse: the prompt, the JSON output, latency (~1.2s),
and token counts — captured with zero code wrapped around the request.
The OpenAI client has no default timeout. If the model is slow or the backend stalls, your
app hangs indefinitely — no error, no trace. timeout=30 turns that into a fast, visible failure.
From one call to a real pipeline — the span tree
One call is easy to log; you don't need Langfuse for that. Tracing earns its keep on multi-step
features, where it shows the whole chain as one tree so you can see which step broke. Let's make
the feature realistic — classify the ticket, then draft a reply from that category (two WEC calls) —
and group them into a single trace with the @observe decorator:
from langfuse import observe, get_client
from app import client, classify              # reuse the traced WEC client + classifier

def draft_reply(ticket: str, category: str) -> str:
    resp = client.chat.completions.create(
        model="Qwen2.5-3B-Instruct",
        name="draft-reply",
        messages=[{"role": "user", "content":
            f"A customer sent this {category} ticket. Write a short, helpful reply.\nTicket: {ticket}"}],
    )
    return resp.choices[0].message.content

@observe()                                     # groups everything below into ONE trace
def handle_ticket(ticket: str) -> str:
    category = classify(ticket)                # child span 1
    reply = draft_reply(ticket, category)      # child span 2
    return reply

if __name__ == "__main__":
    print(handle_ticket("I was charged twice this month."))
    get_client().flush()
Open that trace and you get a tree: handle_ticket → ticket-classify → draft-reply, each
child with its own input, output, latency, and tokens. Now a failure has an address — you can
point at the exact step that broke instead of guessing (we use this in Step 5).
You can now see inside any LLM call in production — input, output, latency, tokens — without writing a line of logging code.
Step 3 — Replay your part-3 dataset through it
To get real signal (not one call), push your part-3 dataset through the classifier so the dashboard has traffic to analyze:
import os, json
from langfuse.openai import openai
from langfuse import get_client
from app import classify   # reuse the traced function

for line in open(os.path.expanduser("~/tickets_dataset.jsonl")):
    if line.strip():
        classify(json.loads(line)["ticket"])
get_client().flush()
Now the Home dashboard shows traces over time, a latency distribution (p50/p95), tokens by model, and a cost total — the "watch it in production" view.
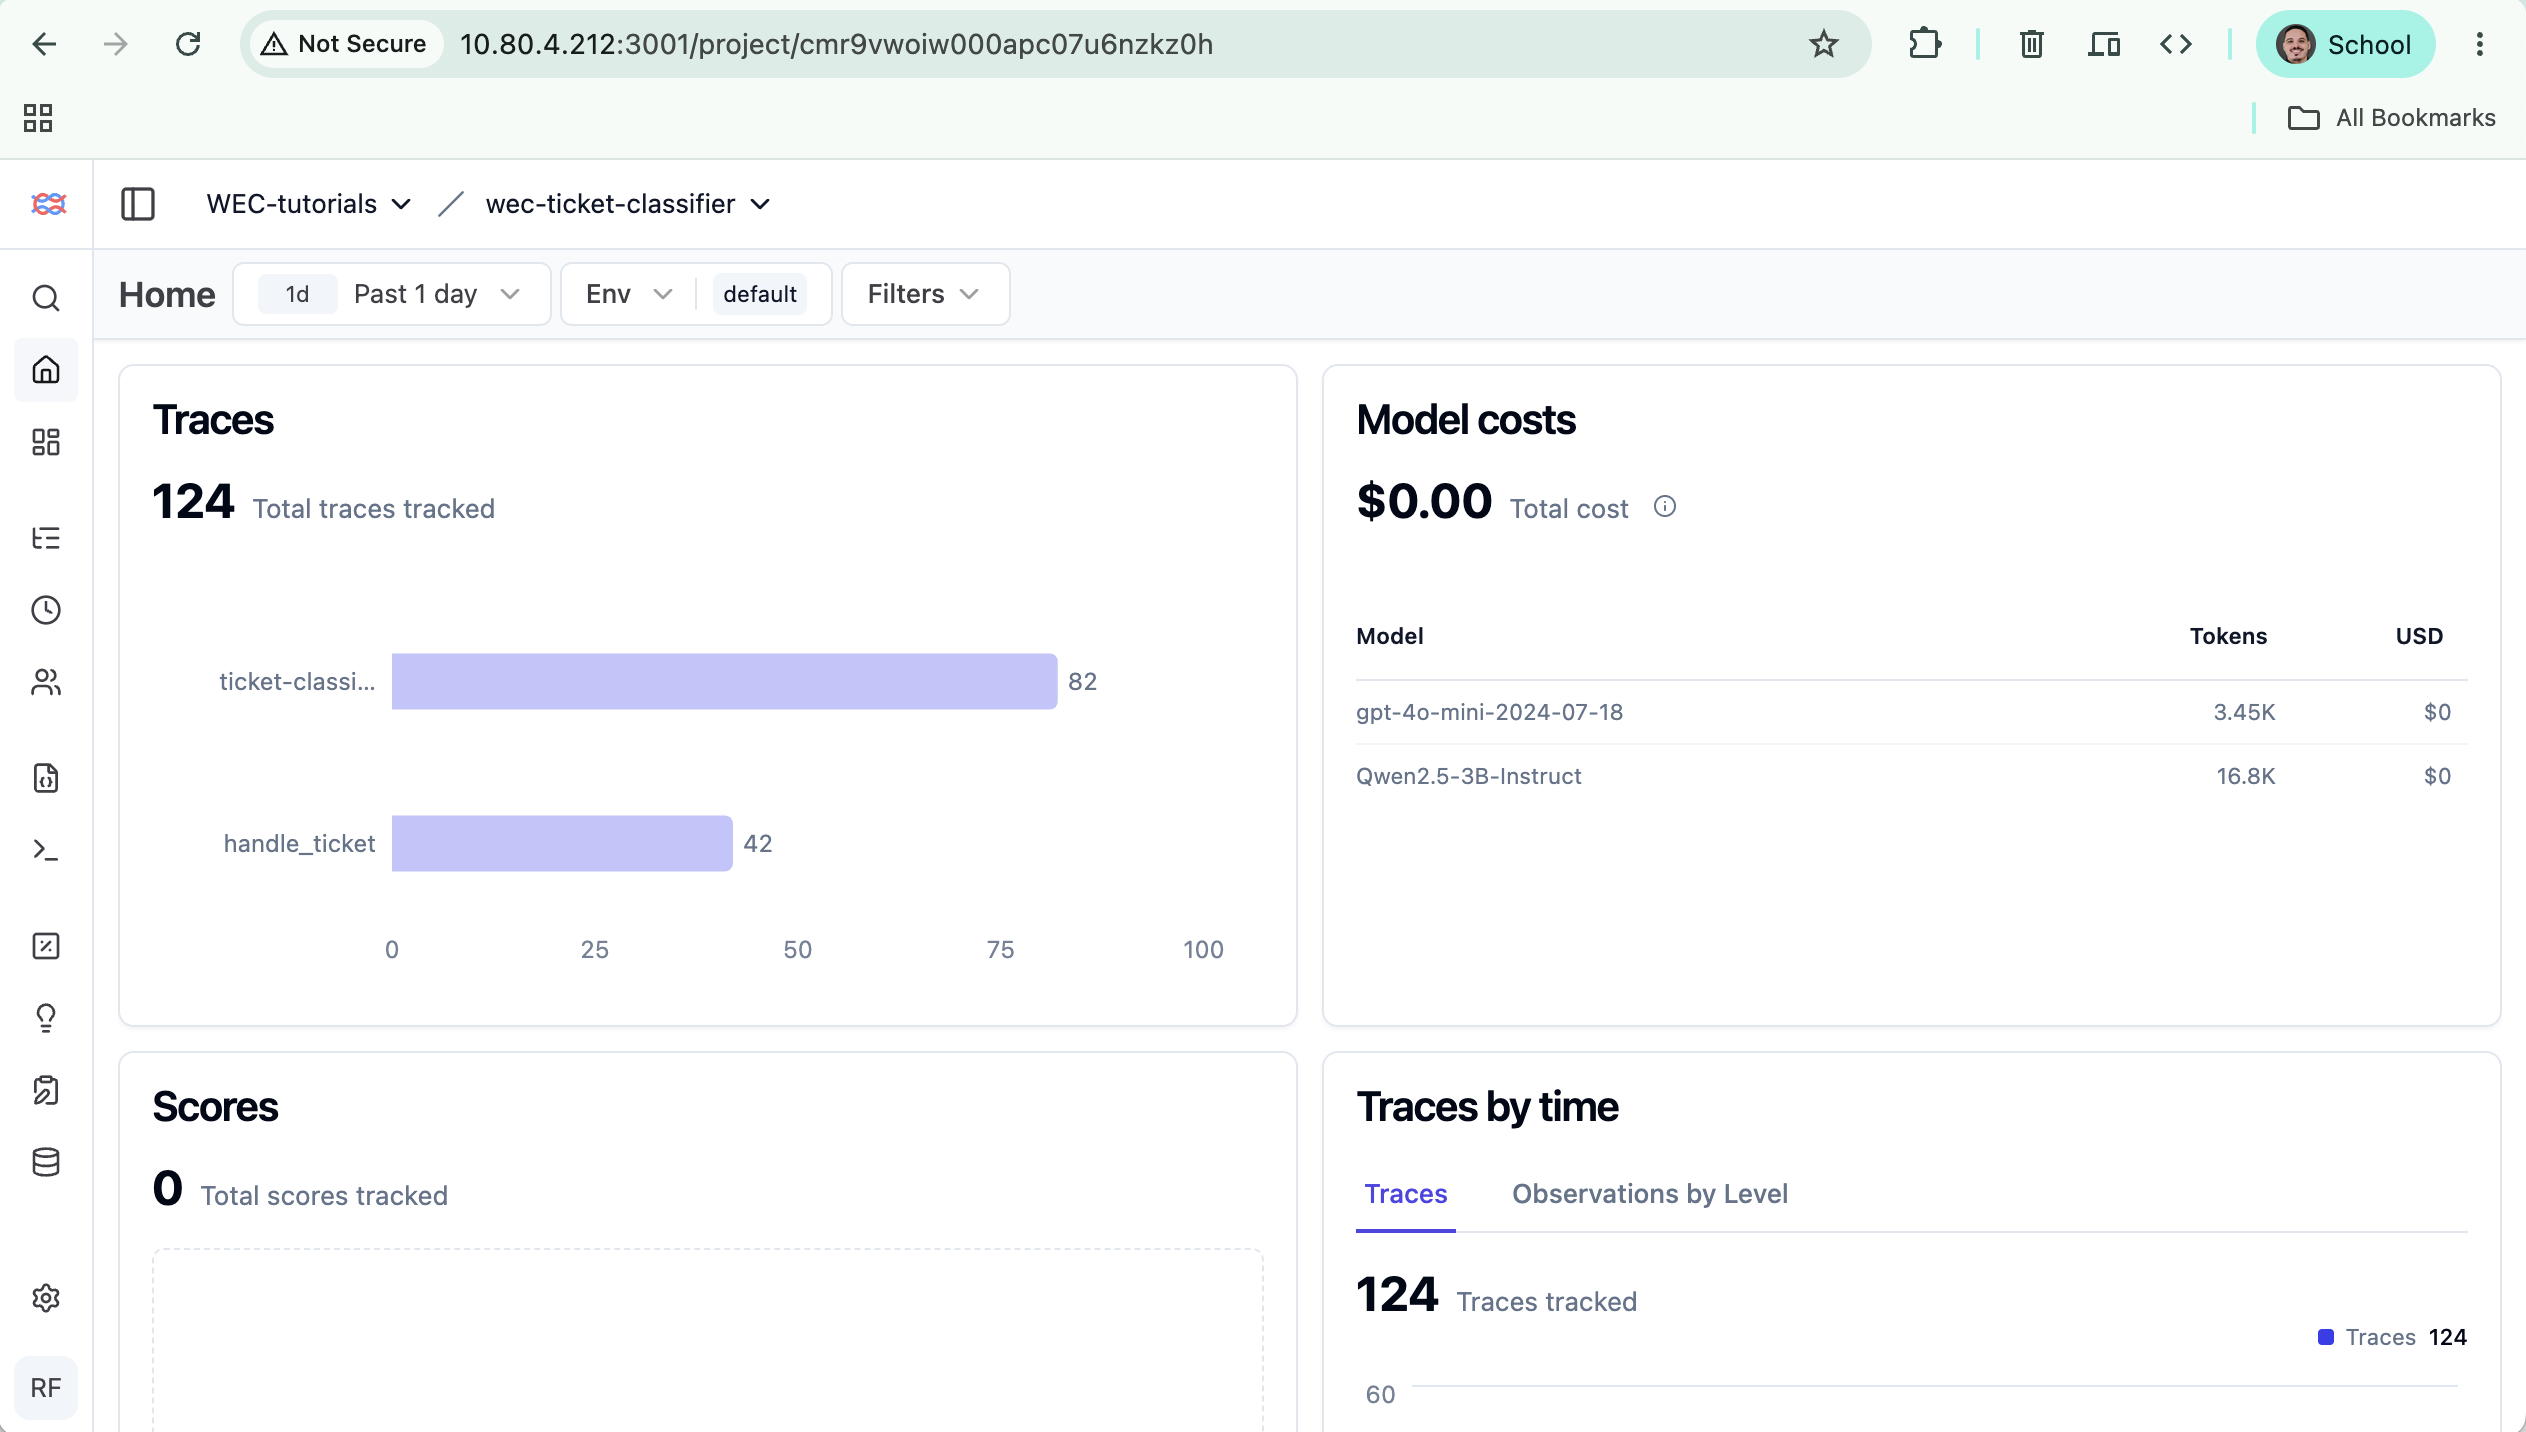 Figure 3. After replaying the part-3 dataset: traces over time, a latency distribution, tokens
by model, and a cost total — the "watch it in production" view.
Figure 3. After replaying the part-3 dataset: traces over time, a latency distribution, tokens
by model, and a cost total — the "watch it in production" view.
Make cost real for WEC models
Langfuse auto-computes cost for models it knows (OpenAI, Anthropic), but the WEC Inference API
returns no dollar cost and Langfuse doesn't know WEC's model prices — so cost shows $0. This is
the same gap we hit in part 1. Fix it once:
Settings → Models → add a model matching Qwen2.5-3B-Instruct with your per-token input/output
prices. Now every trace and the dashboard show real spend — the cost-tracking that Promptfoo
couldn't give us.
Step 4 — Auto-score live traffic with an LLM judge
CI eval checks a fixed set. Here we score every real call automatically with an LLM-as-judge. This step looks like pure configuration — it's also where we hit, and solved, the best bug of the series.
Wire up the judge
Create the evaluator via Evaluators → + New evaluator. It's a 3-step wizard:
1. Select Evaluator — pick the Correctness LLM-as-judge template.
2. Set up LLM connection — the judge needs a model to call, and there's none yet, so click + Add LLM Connection. The dialog has more fields than you'd expect — here's exactly what each one needs:
- LLM adapter:
openai - Provider name: any label without colons (e.g.
wec-judge) — just the connection's name in Langfuse - API Key: your WEC key
- Click Show advanced settings:
- API Base URL:
https://inference.wiline.com/v1— critical; left blank it hits real OpenAI - Use Responses API: leave off (WEC speaks Chat Completions)
- Extra Headers: none — skip
- Enable default models: turn off (you don't want OpenAI's model list here)
- Custom models → Add custom model name:
Qwen3.5:9B— the model choice matters a lot here, as you're about to see
- API Base URL:
- Create connection, then select provider
wec-judgeand modelQwen3.5:9B→ Save.
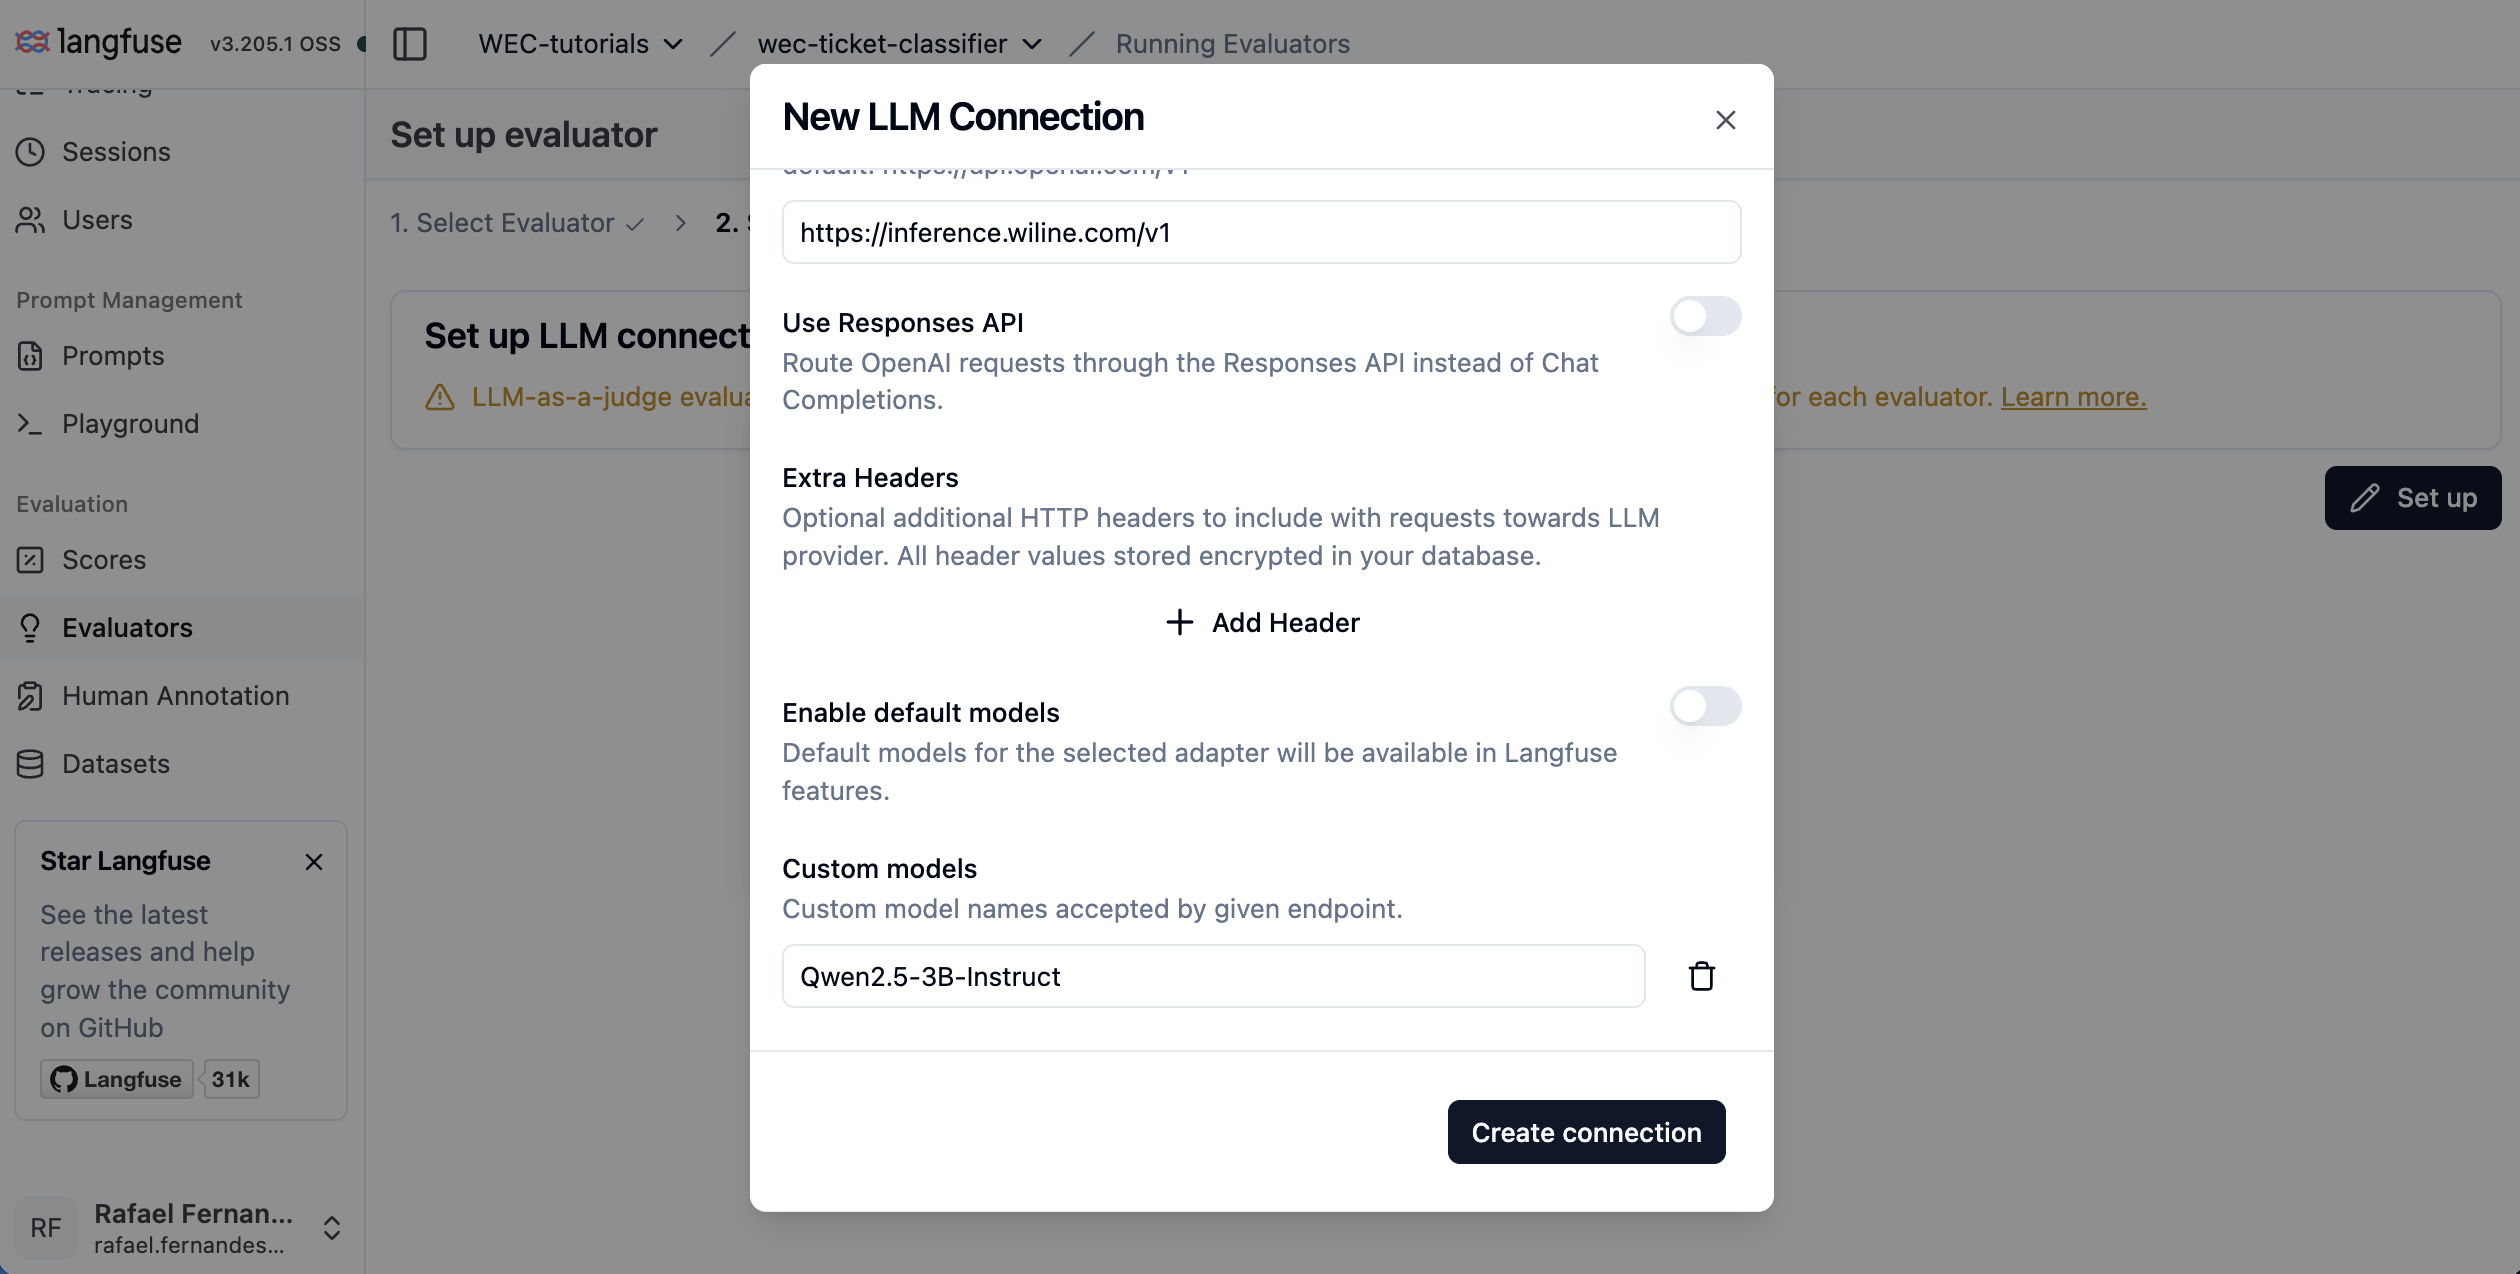 Figure 4. The New LLM Connection dialog: adapter
 openai, the WEC API Base URL, default
models switched off, and a custom model added — this is what points the judge at WEC instead of
real OpenAI.
3. Run Evaluator — add a filter Name = ticket-classify, toggle Run on live incoming
observations so it scores new traffic, and Execute.
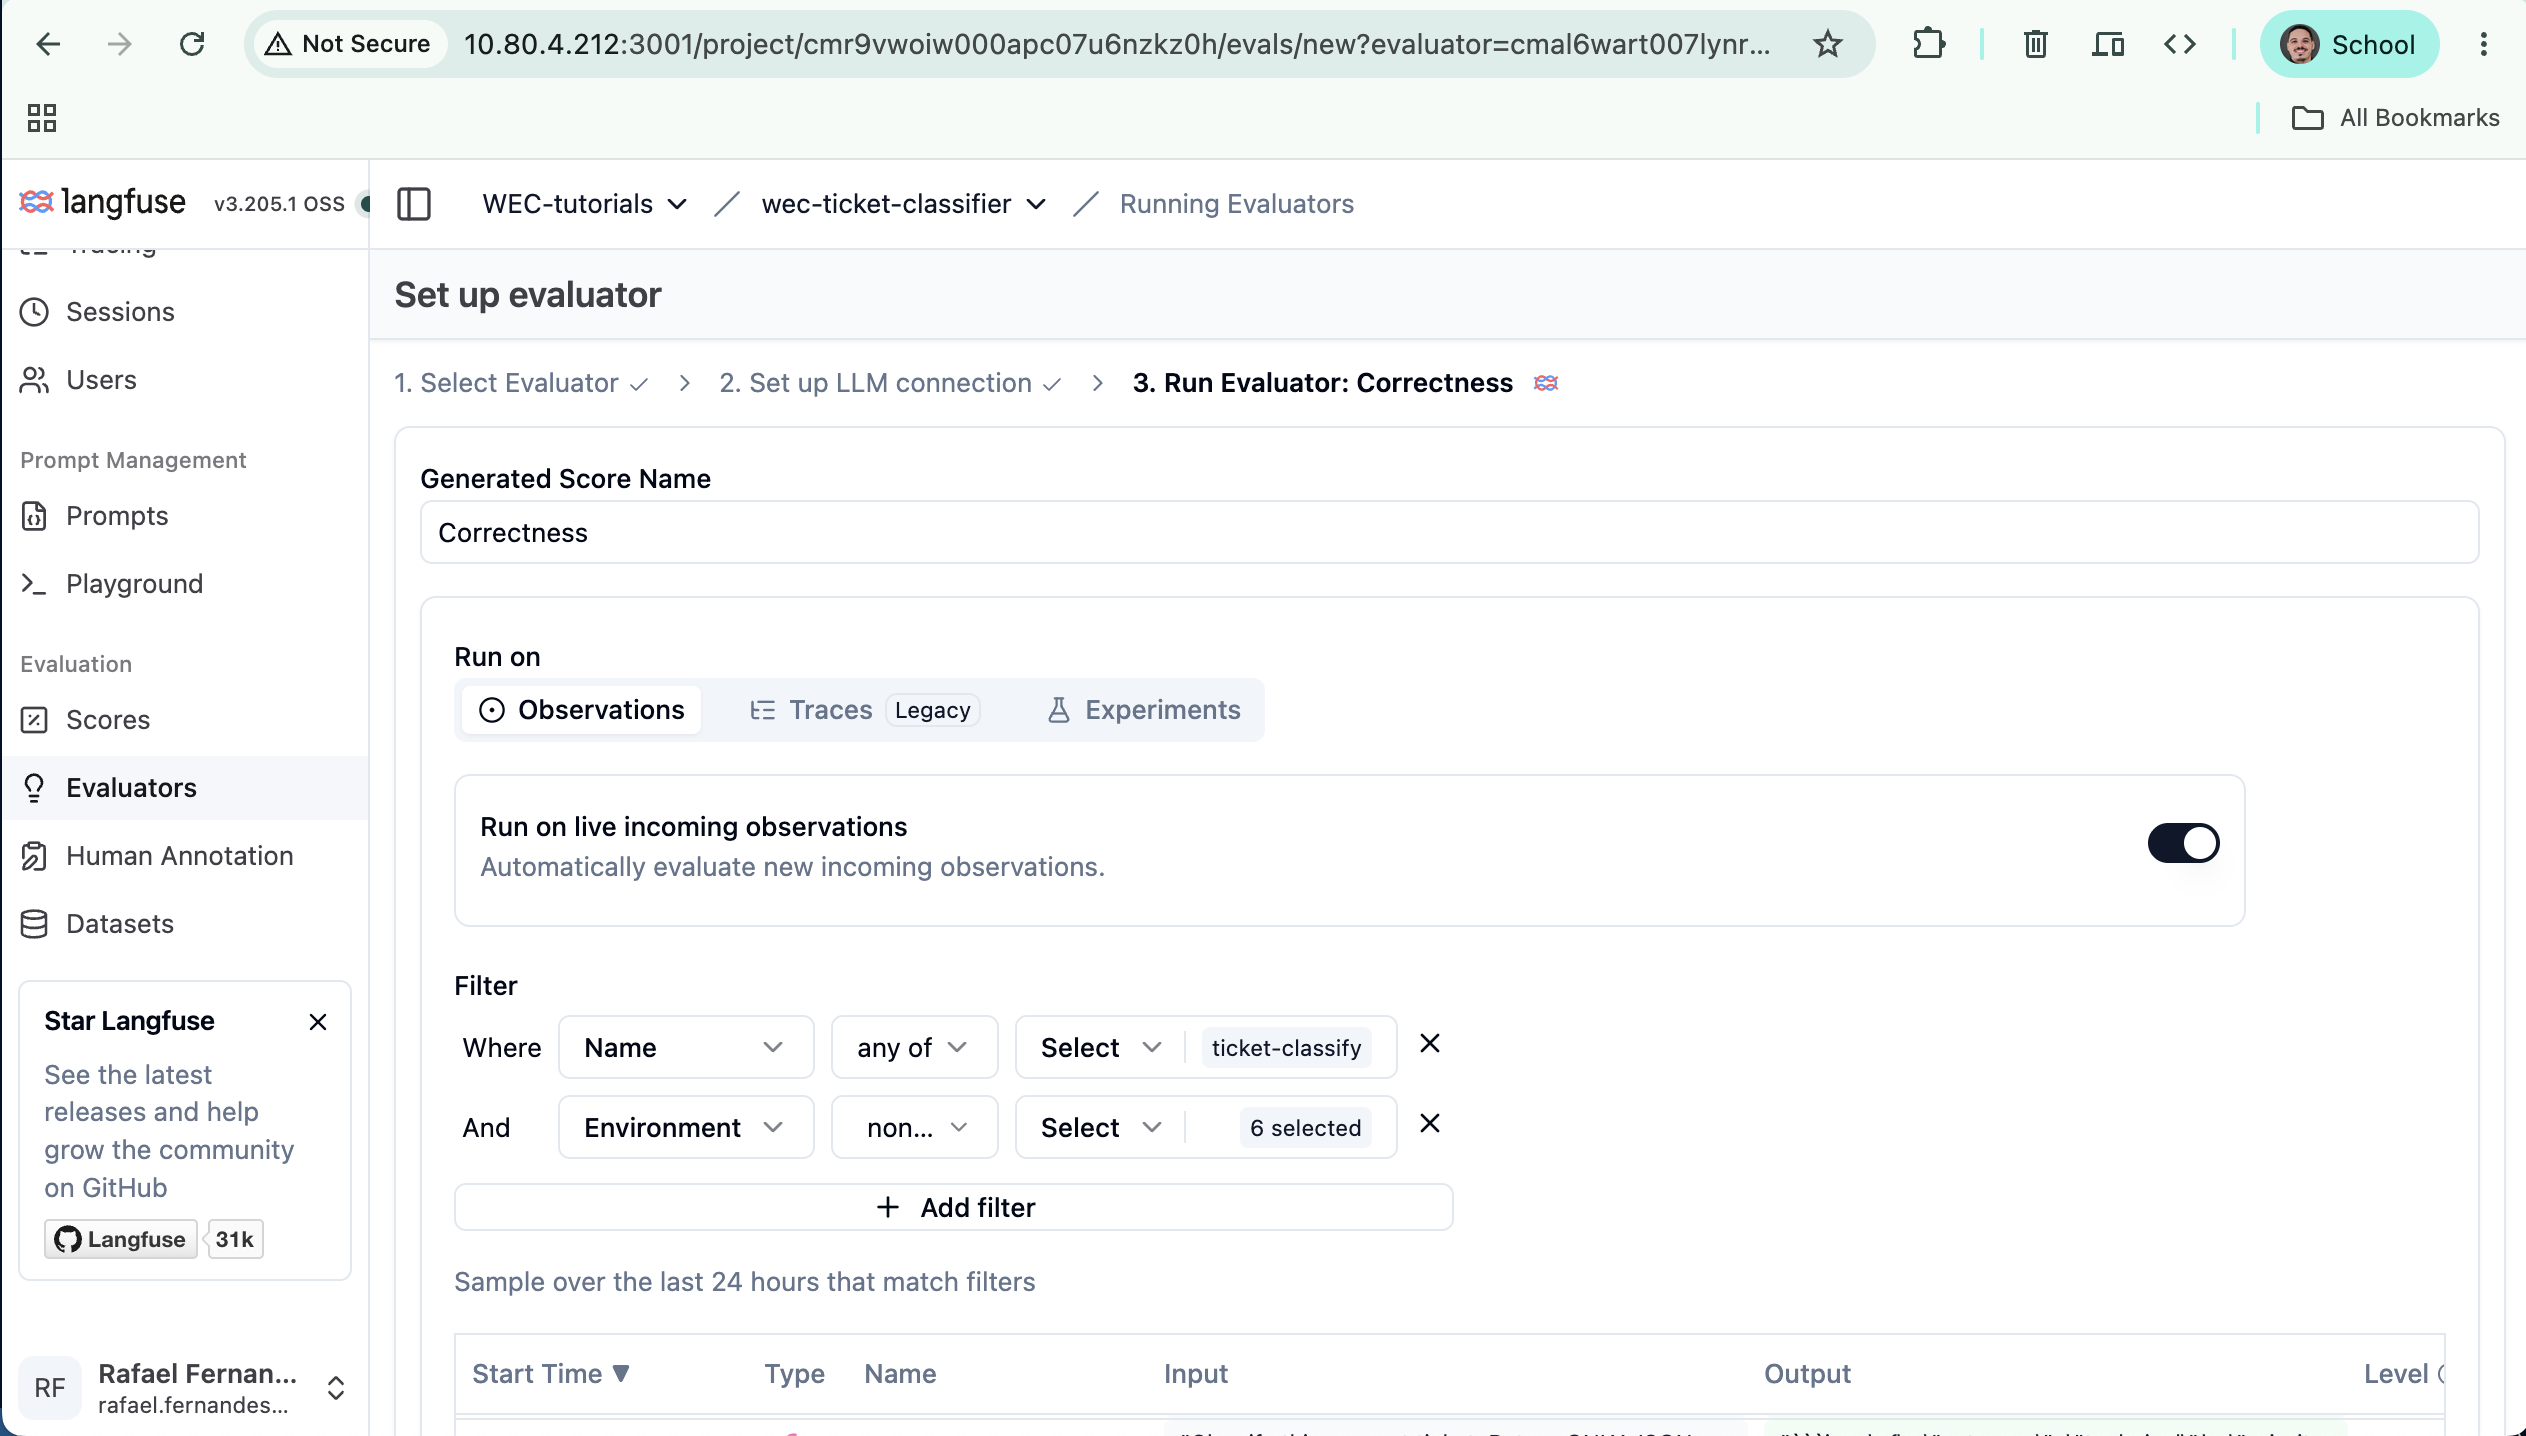 Figure 5. The Correctness evaluator — score name, the
 ticket-classify filter, and "run on
live incoming observations."
Then: no scores. Debugging the 120-second timeout
We configured everything, sent fresh traffic… and nothing. No score on any trace. Here's how we tracked it down — you may hit the same wall:
- Check the evaluator's log. Evaluators → your evaluator → Logs had the real error:
Request timed out after 120000ms. Every run, exactly 120s — so the judge was firing, its LLM call just never came back. - Suspect the model. Our first judge,
Qwen2.5-3B-Instruct, rejected tool calls outright (instant 400 — a missing vLLM config on the backend; more on that below). We switched toQwen3.5:9B, which answers a direct tool call in ~3s. Still timed out. - Suspect the network.
curlfrom the host: 200 in half a second. The same judge-style request from inside the worker container: ~3s. Model, network, container — all fine. - Reproduce what Langfuse actually sends. The judge doesn't call the API like our curl — it
uses structured output (
response_format) so the score comes back machine-readable. Replaying that exact call shape exposed the problem: on this backend, judge-style requests to the reasoning model are wildly slow and unpredictable — the identical request ranged from 3 to 95 seconds across runs (the model "thinks" at length, and JSON mode adds overhead). With the judge's longer real prompt, runs blew past the 120s default. Nothing was broken — it was just slower than the timeout.
The fix is two lines of configuration. Langfuse reads its LLM timeout from
LANGFUSE_FETCH_LLM_COMPLETION_TIMEOUT_MS (default 120000). Give it room:
services:
  langfuse-worker:
    environment:
      LANGFUSE_FETCH_LLM_COMPLETION_TIMEOUT_MS: "600000"
  langfuse-web:
    environment:
      LANGFUSE_FETCH_LLM_COMPLETION_TIMEOUT_MS: "600000"
docker compose up -d langfuse-worker langfuse-web
# verify it landed inside the container:
docker compose exec langfuse-worker env | grep TIMEOUT
Send a fresh trace through app.py, wait a couple of minutes, and:
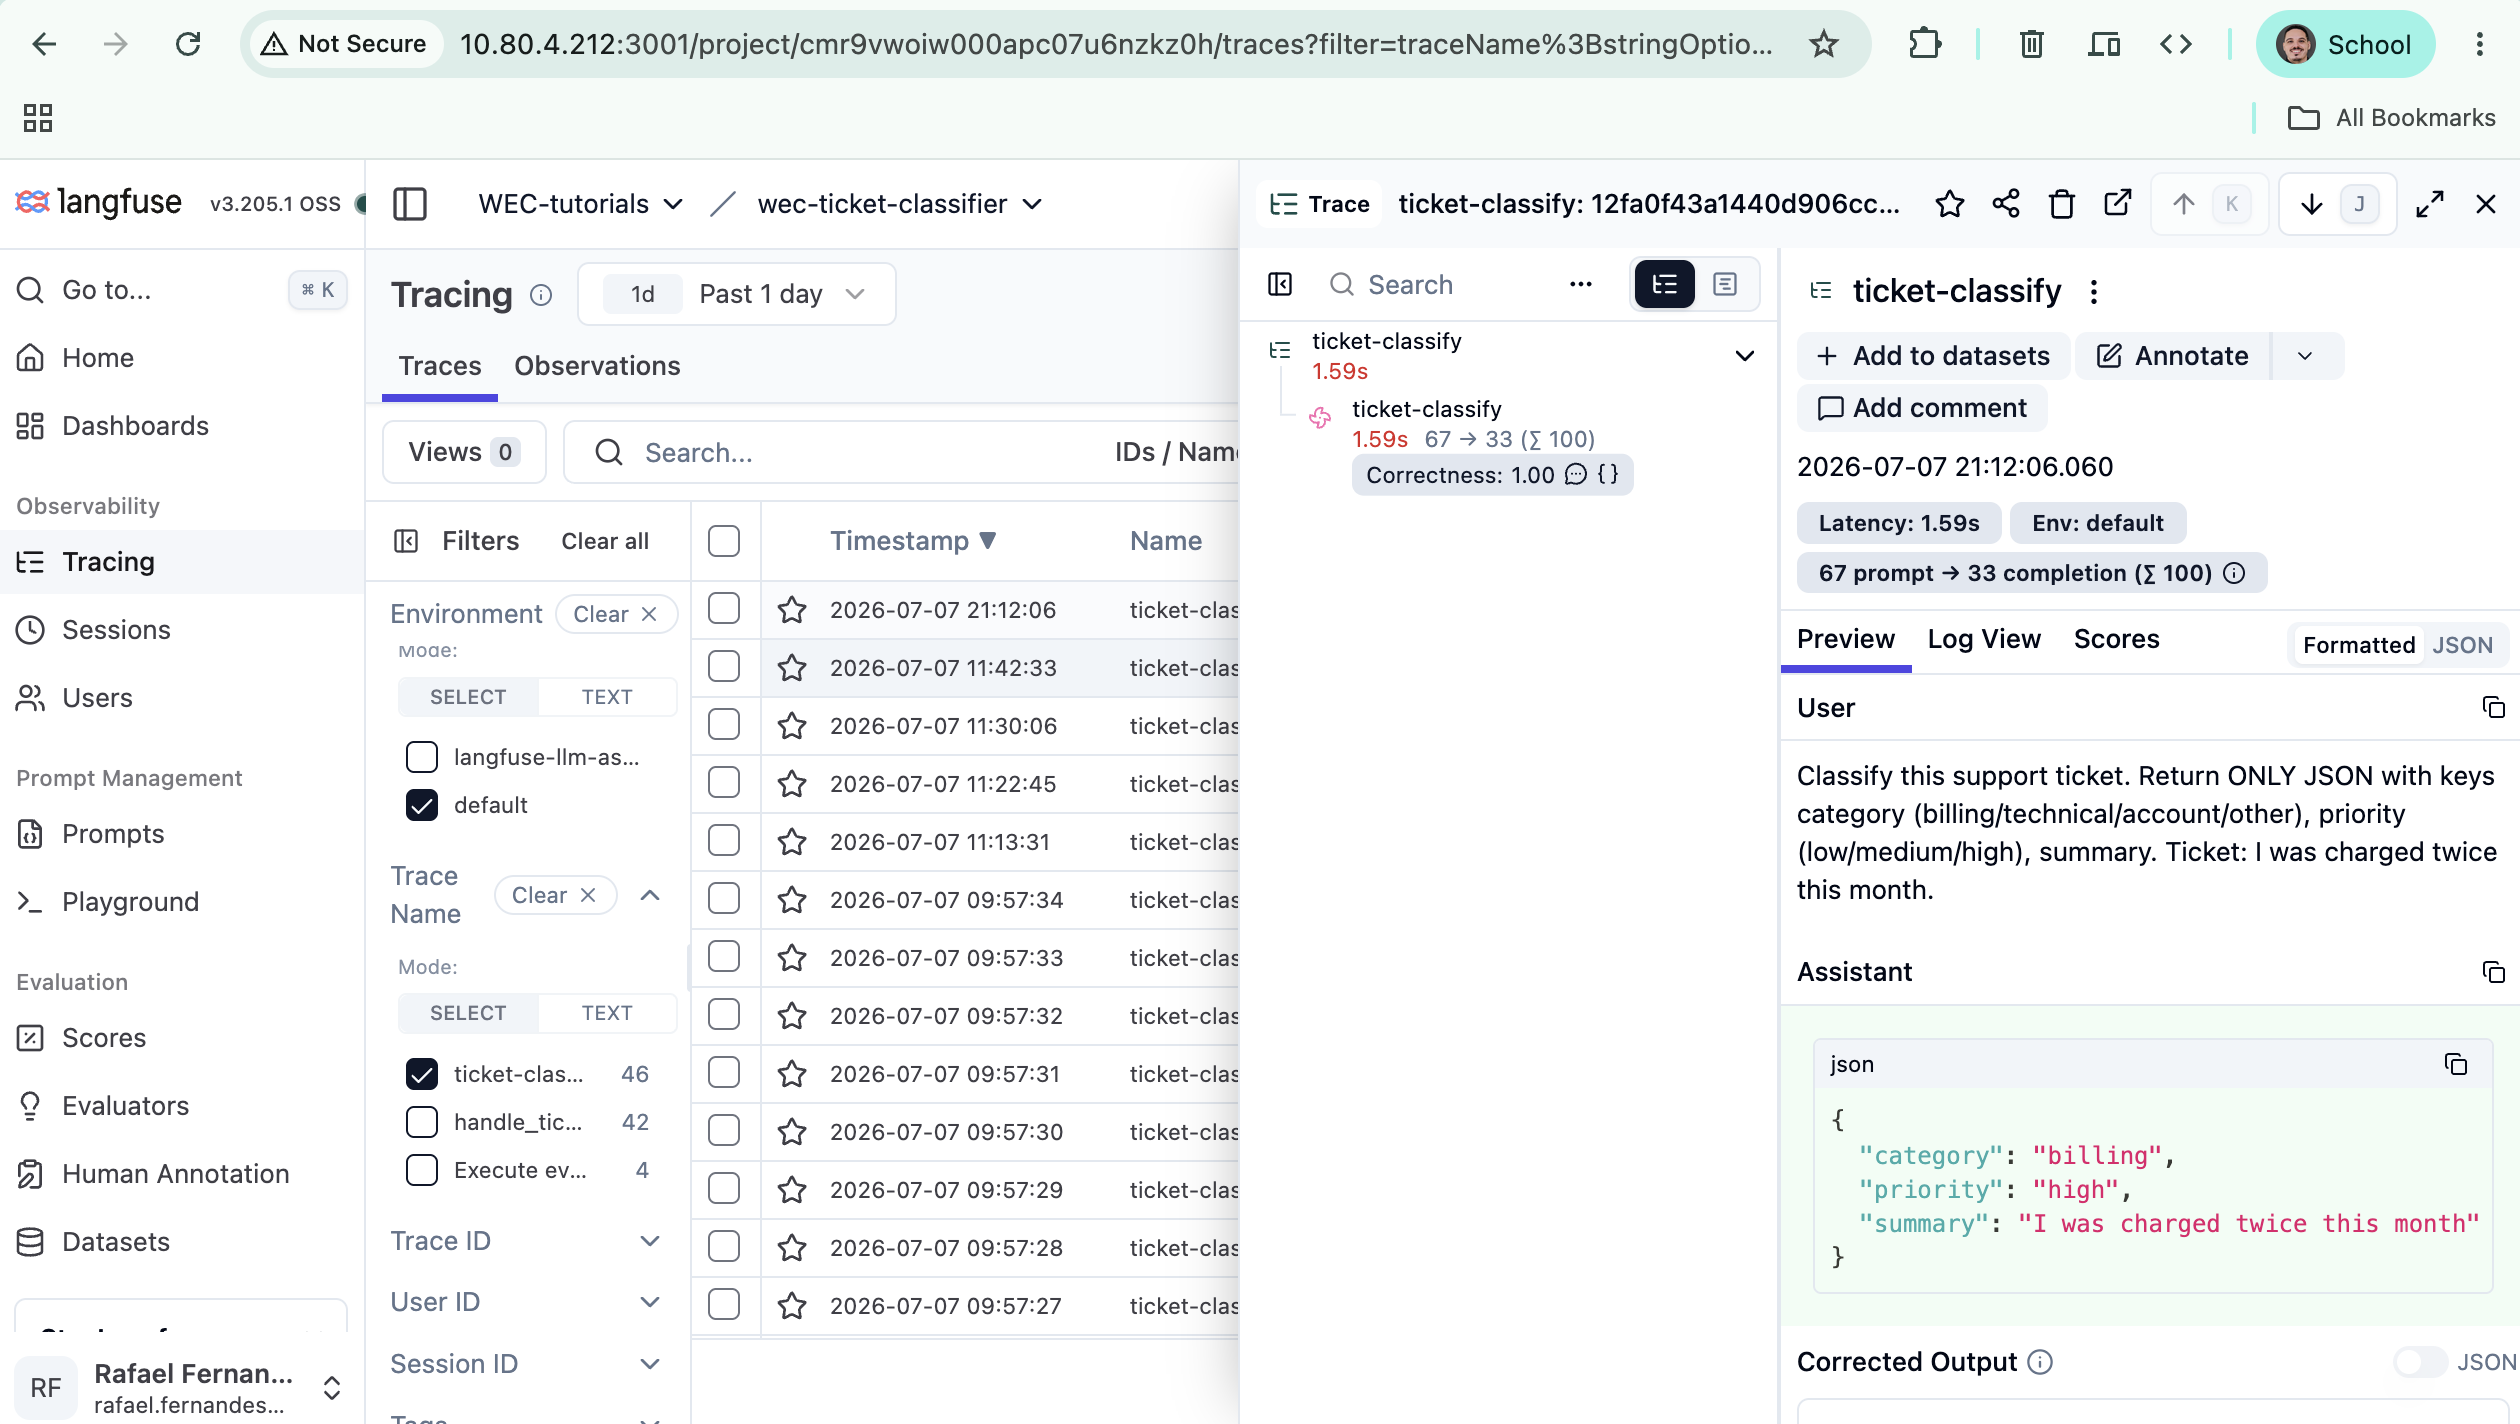 Figure 6. There it is — Correctness: 1.00 attached to a live
 ticket-classify trace, with
the judge's reasoning a click away. Every new call now gets scored automatically.
You can now auto-grade real production traffic — and debug an evaluator that silently produces nothing: check its Logs, isolate model vs. network vs. container, match the timeout to reality.
The judge needs tool calling. If your model returns a 400 on any tools request, that's
usually the serving config, not the model — on vLLM it's the --enable-auto-tool-choice and
--tool-call-parser flags. That was our case: we reported it, the platform team enabled the
flags on Qwen2.5-3B-Instruct the same day, and the 400 disappeared. Only the judge's connection
is affected — your app keeps its model.
Scoring is slow (~2 min/score) and that's the backend, not you. The reasoning model "thinks" at length on judge prompts — worth reporting to your platform team (reasoning budget caps, or a guided-decoding backend like xgrammar on vLLM). The raised timeout keeps scoring reliable meanwhile.
Once tool calling was enabled on Qwen2.5-3B, we tried it as the judge — scores came back in
2–10 seconds instead of ~2 minutes. But they were garbage: the same kind of correct answer got
1, 1, 0, and 0.05 across four runs, with near-identical rationales attached to opposite
scores. The small model fills the score format perfectly; it just can't actually evaluate.
Mirror image of part 3's finding: the small
model wins at classifying and loses at judging — judging is a reasoning task. Keep the judge
on Qwen3.5:9B: slow but coherent.
Step 5 — Find the failure your tests missed
This is where the span tree pays off. Open a handle_ticket trace and you don't get one opaque
blob — you get the whole chain as a tree, each step with its own input, output, latency, and
tokens:
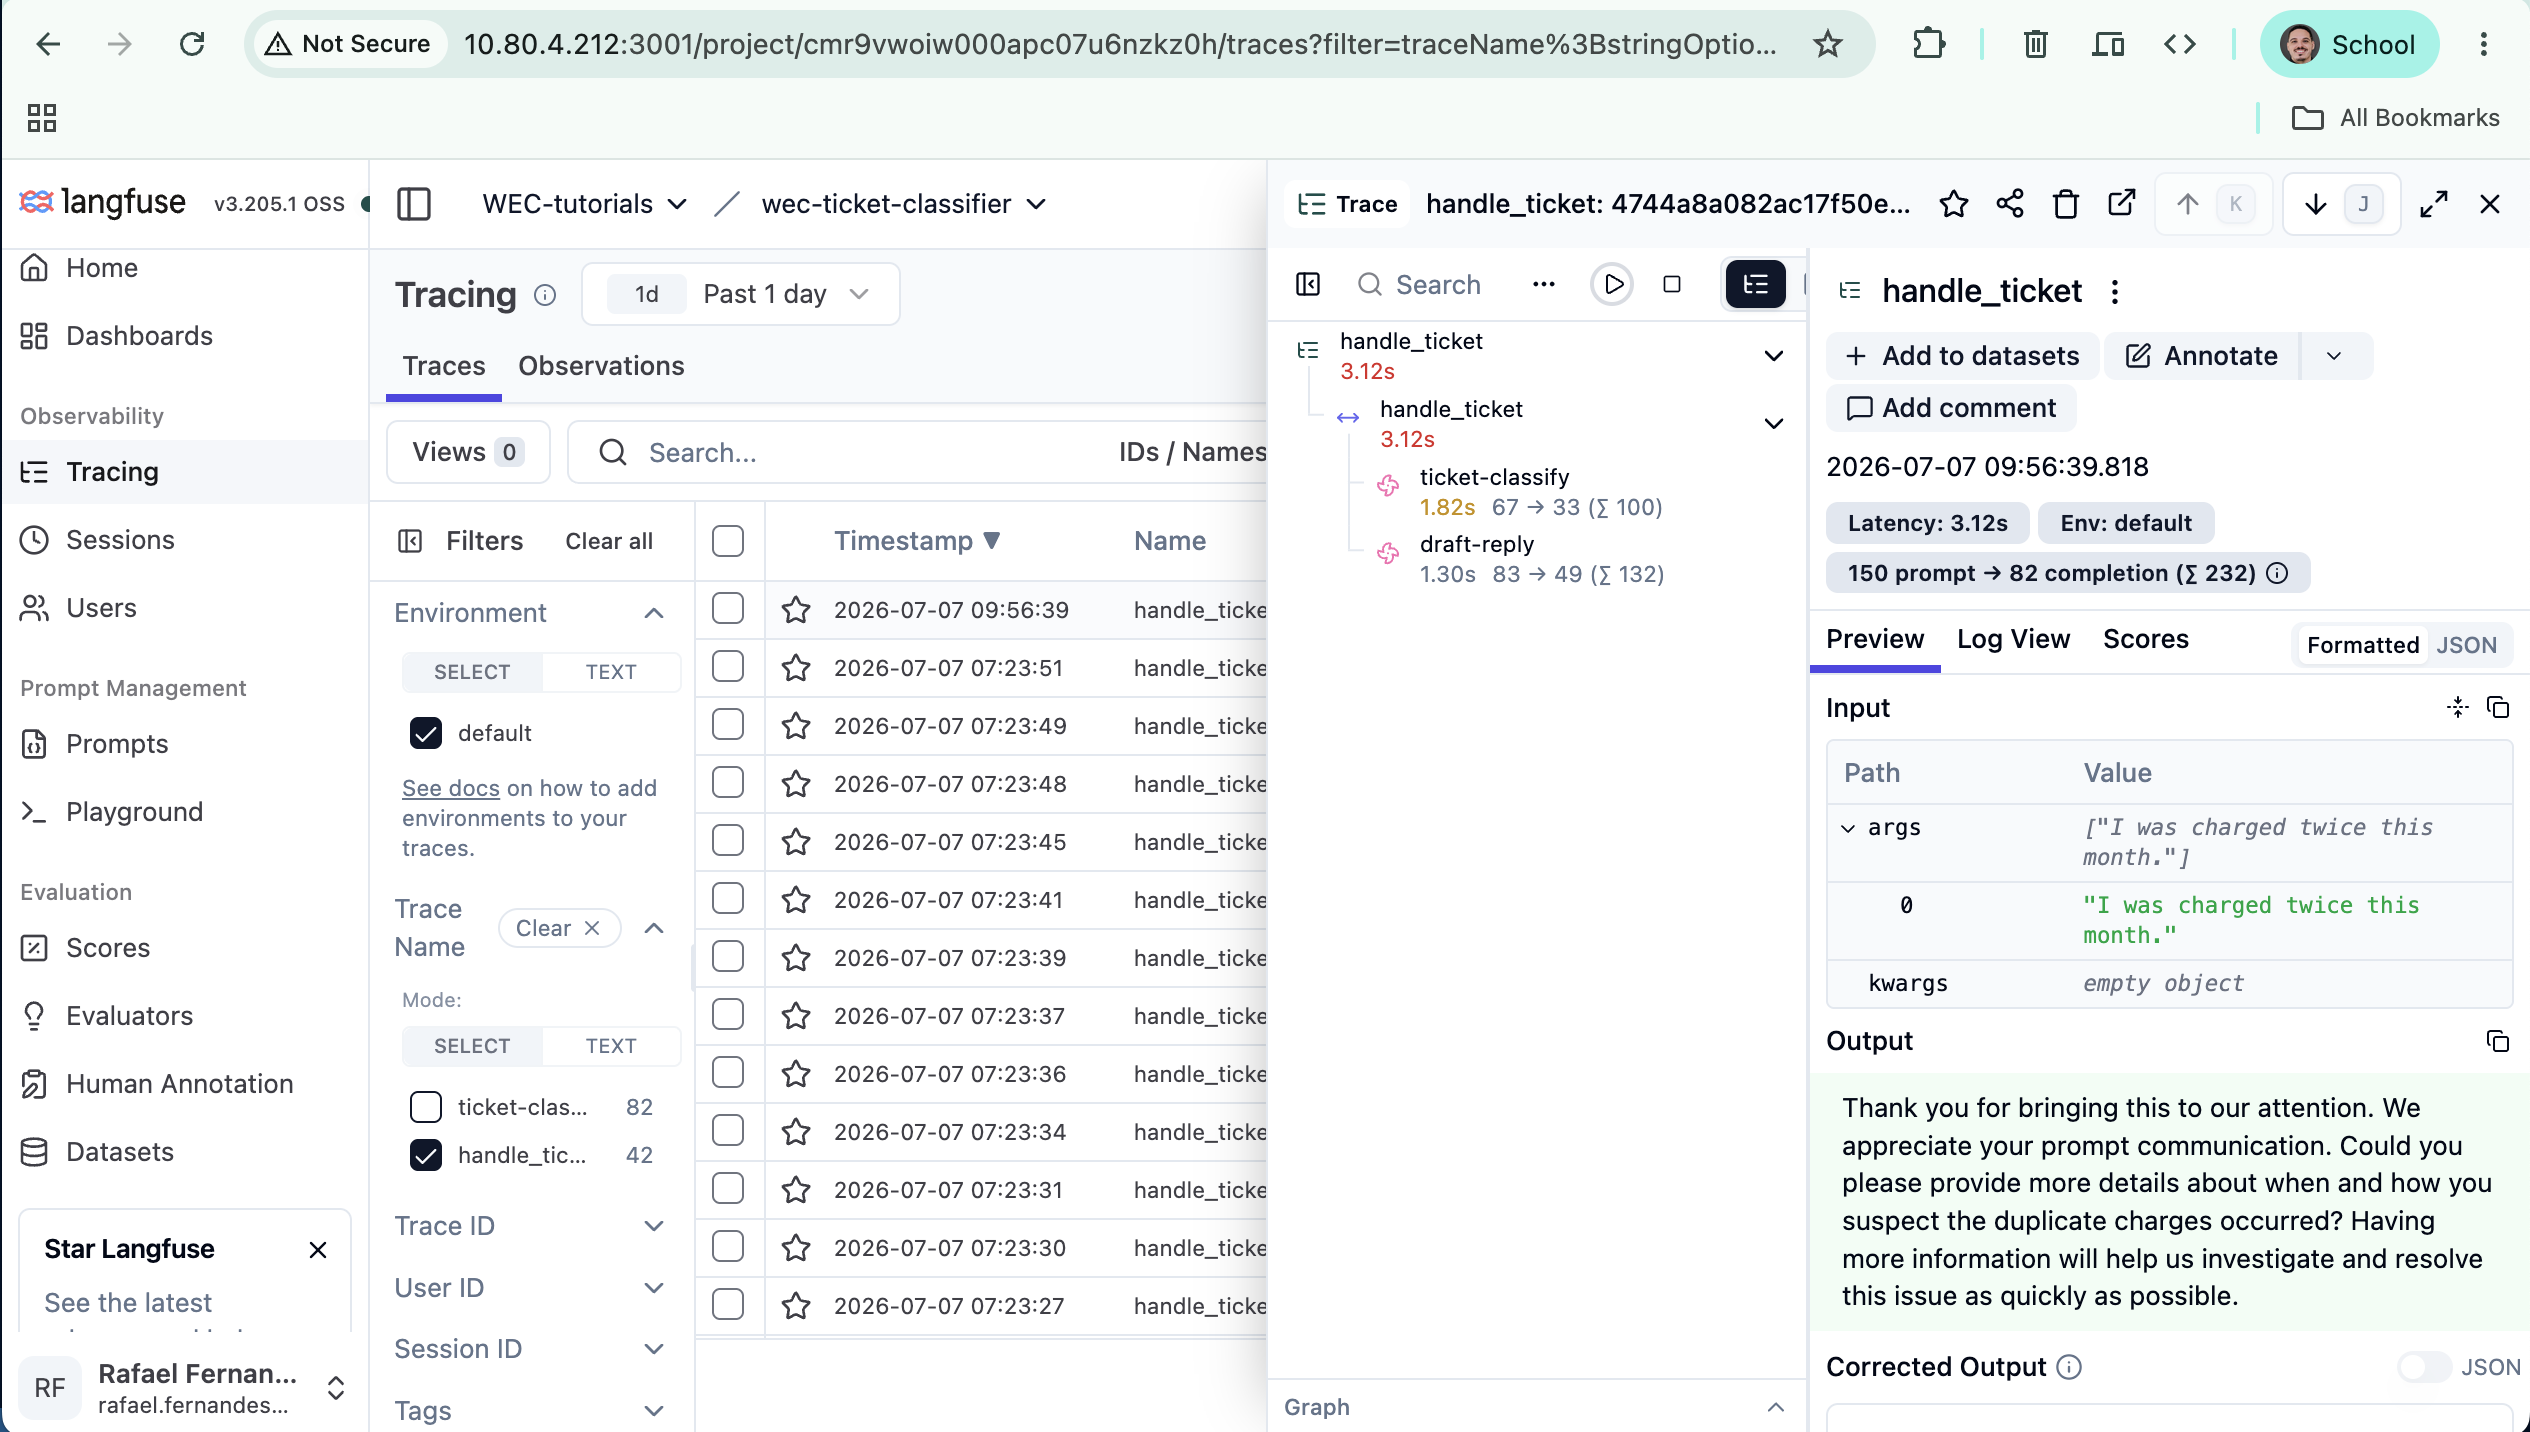 Figure 7. The
 handle_ticket tree — handle_ticket → ticket-classify → draft-reply — with
per-step latency and tokens. Every step has an address you can inspect.
That structure is what makes production failures debuggable. Say a customer gets a nonsense reply. Without tracing you'd only know "the reply was bad." With the tree you expand it and read each step — for example:
ticket-classify→category: "billing"✅ correct — so the classifier isn't the problem.draft-reply→ invented a refund policy that doesn't exist ❌ — the bug is in step 2.
You've localized the failure to the exact step, input, and output — you'd fix the draft-reply
prompt, not waste time on the classifier. Offline eval tells you the pass rate dropped; the trace
tells you which call, on which input, produced which wrong output, at which step. And now that
Step 4 scores every call, you don't even have to hunt: filter Tracing by low score and the
suspicious traces surface themselves — often a phrasing your part-3 dataset never covered, which is
exactly what you capture back next.
You can now pin a production failure to the exact step, input, and output — no more guessing which call invented that refund policy.
Step 6 — Close the loop: production → better evals
A production failure is a missing test case — and Langfuse makes capturing it one click. Create
the dataset once (Datasets → + New dataset, e.g. production-failures), then on any trace click
+ Add to datasets and pick it. The trace's input and output are prefilled as a new item:
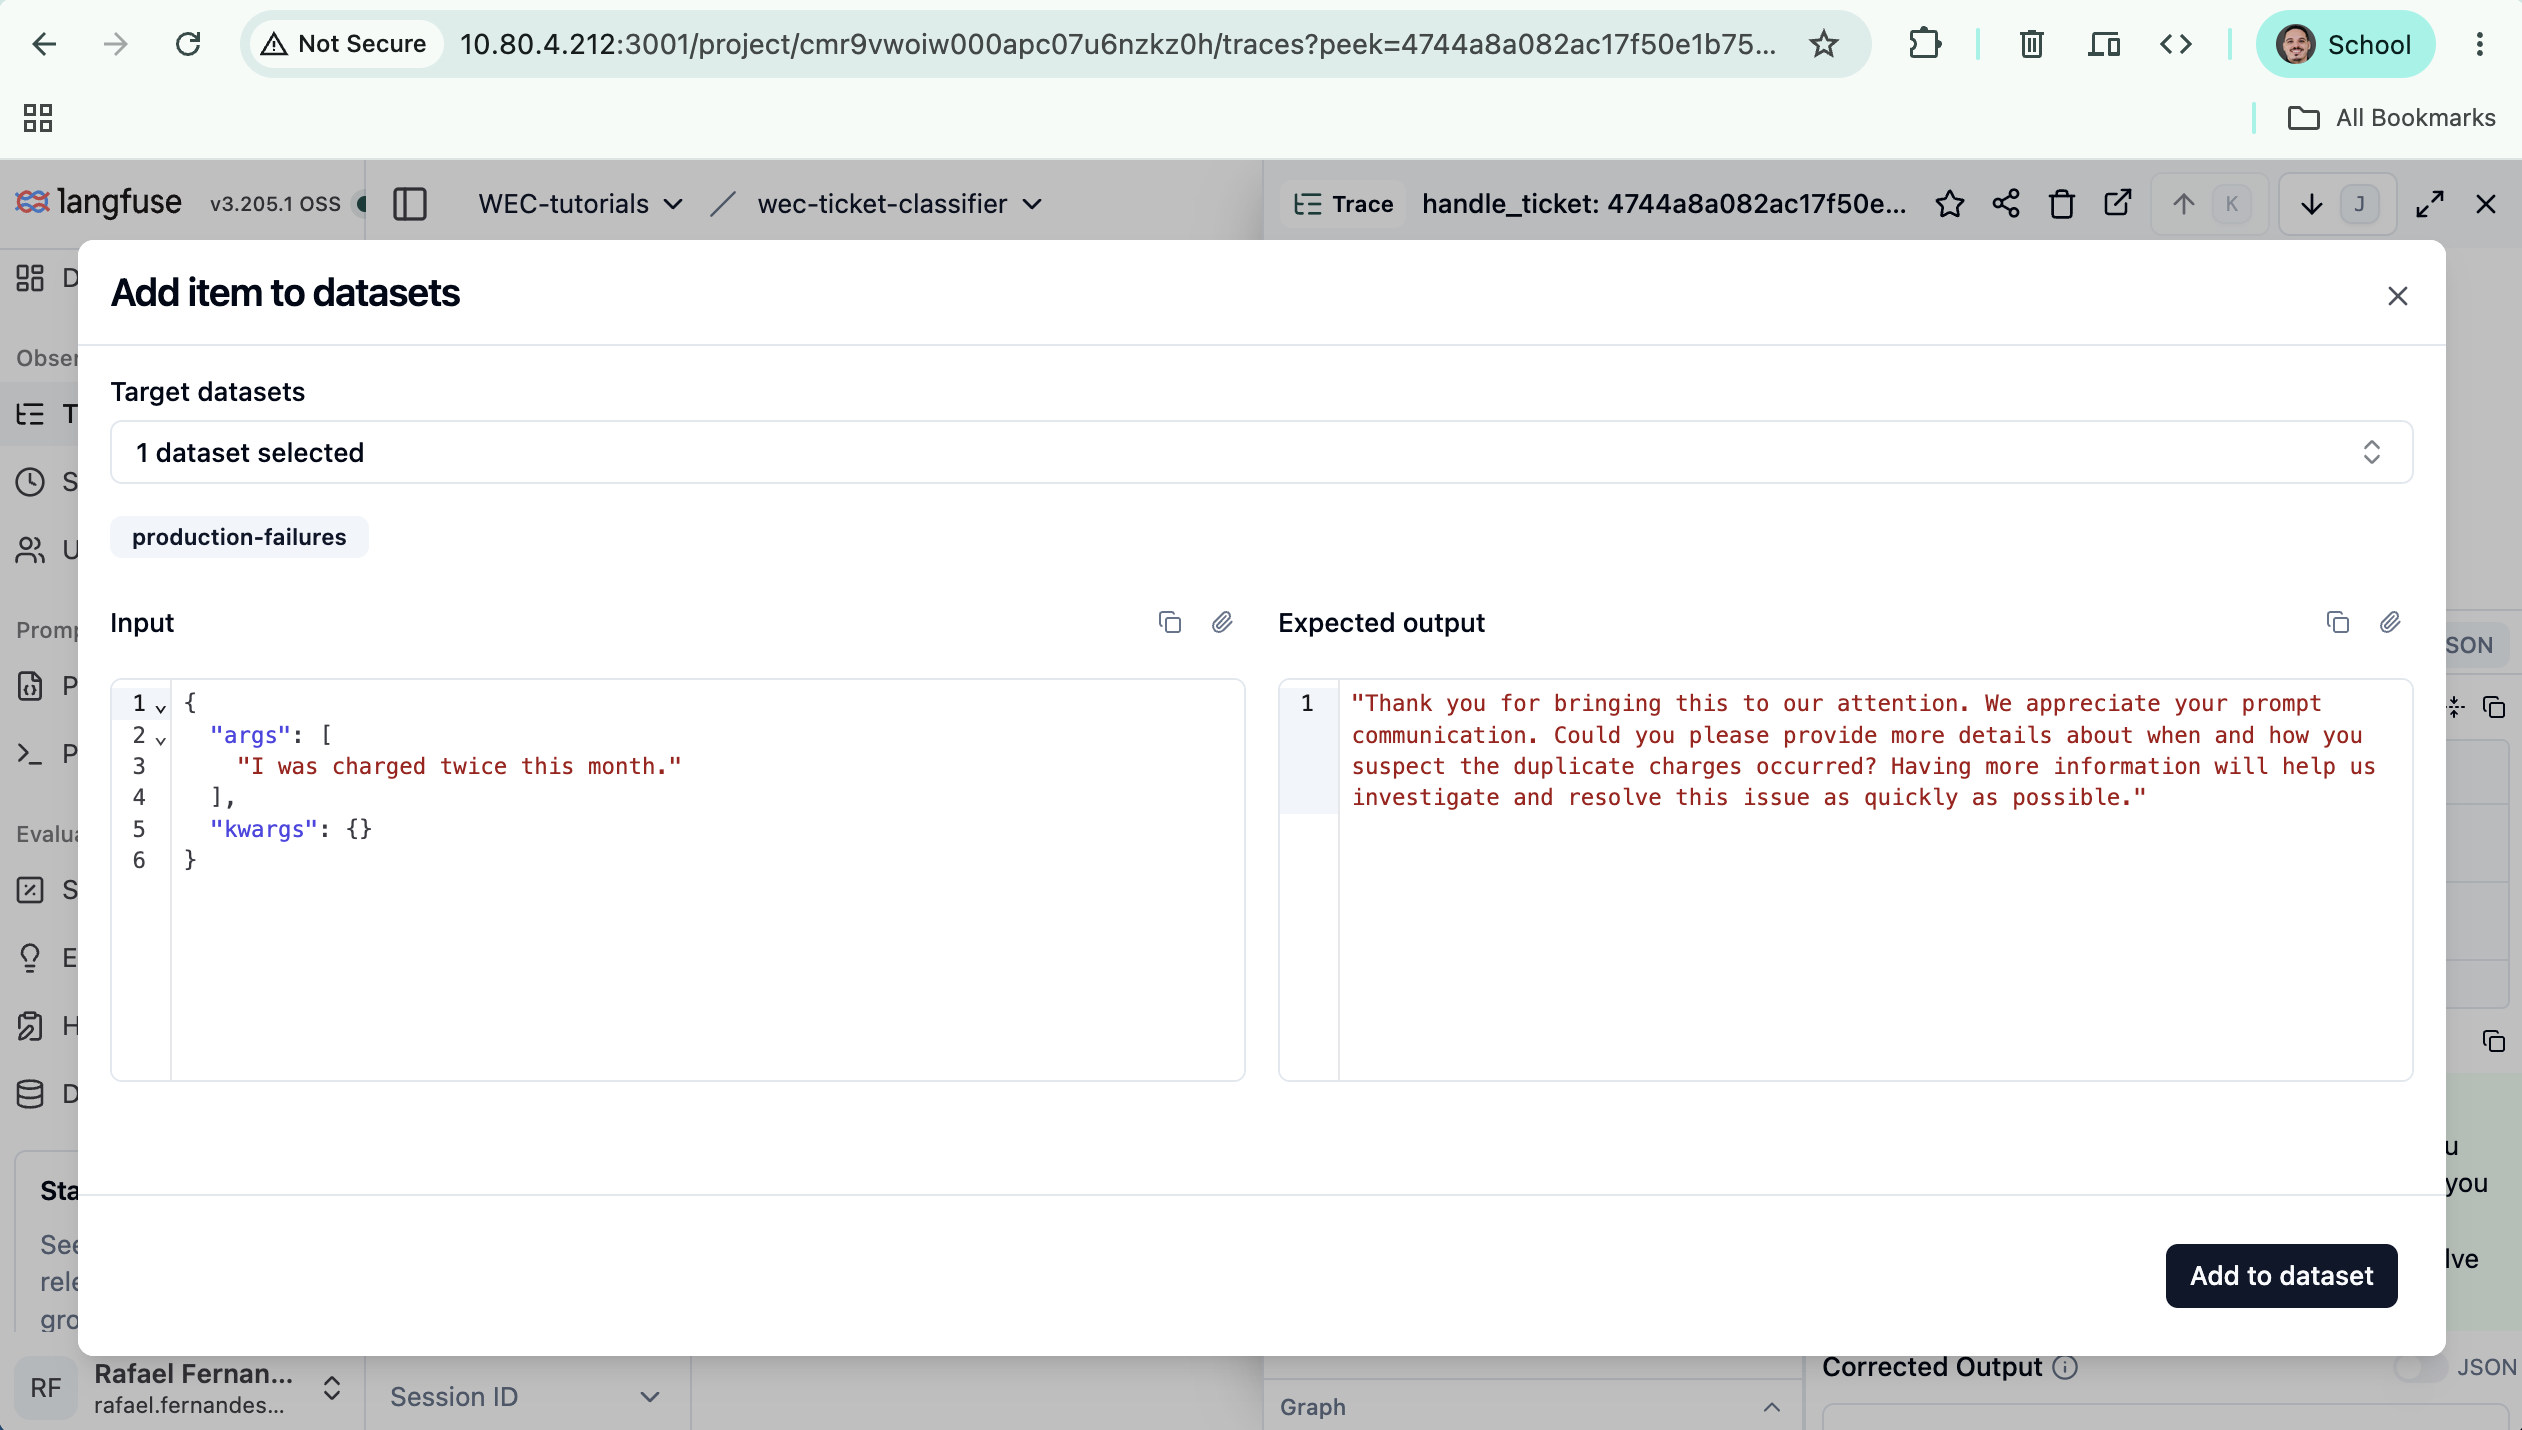 Figure 8. "Add to datasets" turns a production trace into a new test case — input and expected
output prefilled — feeding it straight back into your part-3 dataset.
Figure 8. "Add to datasets" turns a production trace into a new test case — input and expected
output prefilled — feeding it straight back into your part-3 dataset.
To automate it, pull the traces you've bookmarked or added to a dataset via the Langfuse SDK, write
{ticket, category, priority} rows into tickets_dataset.jsonl, and re-run the part-1/part-3
Promptfoo eval — now it covers the real-world case.
Now your CI eval is stronger because production found a hole in it. That's the flywheel: offline eval → ship → observe & score real traffic → capture failures → offline eval gets stronger.
You've closed the loop: production failures now make your evals stronger — the flywheel that keeps an AI feature good after it ships.
What you can now do
- See inside every WEC call in production (input/output/latency/cost).
- Score real traffic automatically with an LLM judge — and debug the evaluator itself when it goes quiet.
- Debug a specific failure down to the exact step, not just an aggregate metric.
- Turn production failures into test cases, so your evals keep improving.
That's the "keep it good after shipping" rung. Offline eval (parts 1–3) proves it works before launch; this proves — and keeps — it working after.
Troubleshooting
"address already in use" on docker compose up
Another service holds port 3000 (web) or 5432 (Postgres). The databases don't need host ports —
in docker-compose.yml, remap langfuse-web to a free port (3001:3000) and remove the Postgres
host mapping. Compose merges ports lists, so an override file with ports: [] won't remove
them; edit the compose directly.
The web container won't start
Almost always ENCRYPTION_KEY — it must be openssl rand -hex 32 (64 hex chars), not base64.
Check docker compose logs langfuse-web.
Cost shows $0
Langfuse has no price for WEC's models by default. Add the model + per-token prices under Settings → Models (Step 3).
No scores appear on new traces
Check Evaluators → your evaluator → Logs first — an error there tells you it's running and failing, not idle. Then match the error:
- A 400 mentioning tool calls /
tool_choice— tool calling isn't enabled for that model on the serving backend (on vLLM: the--enable-auto-tool-choice/--tool-call-parserflags). Two ways out: point the judge's LLM Connection at a model where it works (Qwen3.5:9B), or ask your platform team to enable the flags — that's what fixedQwen2.5-3B-Instructfor us. Either way, only the judge changes — your app keeps its model. Request timed out after 120000ms— the judge's structured-output call is slower than Langfuse's default timeout. RaiseLANGFUSE_FETCH_LLM_COMPLETION_TIMEOUT_MS(Step 4) and confirm withdocker compose exec langfuse-worker env | grep TIMEOUT. If plaincurlis fast but scoring still times out, don't chase the network — the structured-output path is what's slow, and that's a backend fix.
Scores take ~2 minutes each
That's not a hang — it's the reasoning model generating long hidden chain-of-thought on judge prompts (highly variable: the same request can take 3s or 95s), plus structured-output overhead. Raising the timeout makes scoring reliable but not fast — the real fix is platform-side (reasoning budget caps, guided-decoding backend).
What's next
You can now build, prove, observe, and improve a single WEC feature. The last rung is the real app pattern: RAG — retrieval + generation — with everything from parts 1–4 baked in (schema-checked output, an eval dataset, and Langfuse tracing over the whole pipeline). That's where it all comes together.