Clean traces, untouched answers: masking PII in LiteLLM's logs without corrupting the response

 +
+ +
+
- 1One endpoint, scoped keys
- 2Route work to the right model
- 3Mask PII at the gateway
- 4Clean traces, untouched answers
- 🏆Prove it holds under load
Part 3 configured Presidio to mask prompts at logging time and deliberately stopped short of proving it. Nothing had been wired to a logging destination yet, so there was no trace to inspect.
This post wires one up, finds <PERSON> where it should be — and then finds the
customer's real email address sitting a few lines below it, in the model's reply.
Everything in this post follows from where those two hooks sit. post_call fires
before the arrow back to the caller, so masking there rewrites the answer they
receive. async_logging_hook fires after it, on the branch to the logger only.
Sending the gateway's traffic to Langfuse
Langfuse is already running in this series; if you followed the observability tutorial you have an instance. Create a project for the gateway, then take its two keys from Settings → API Keys.
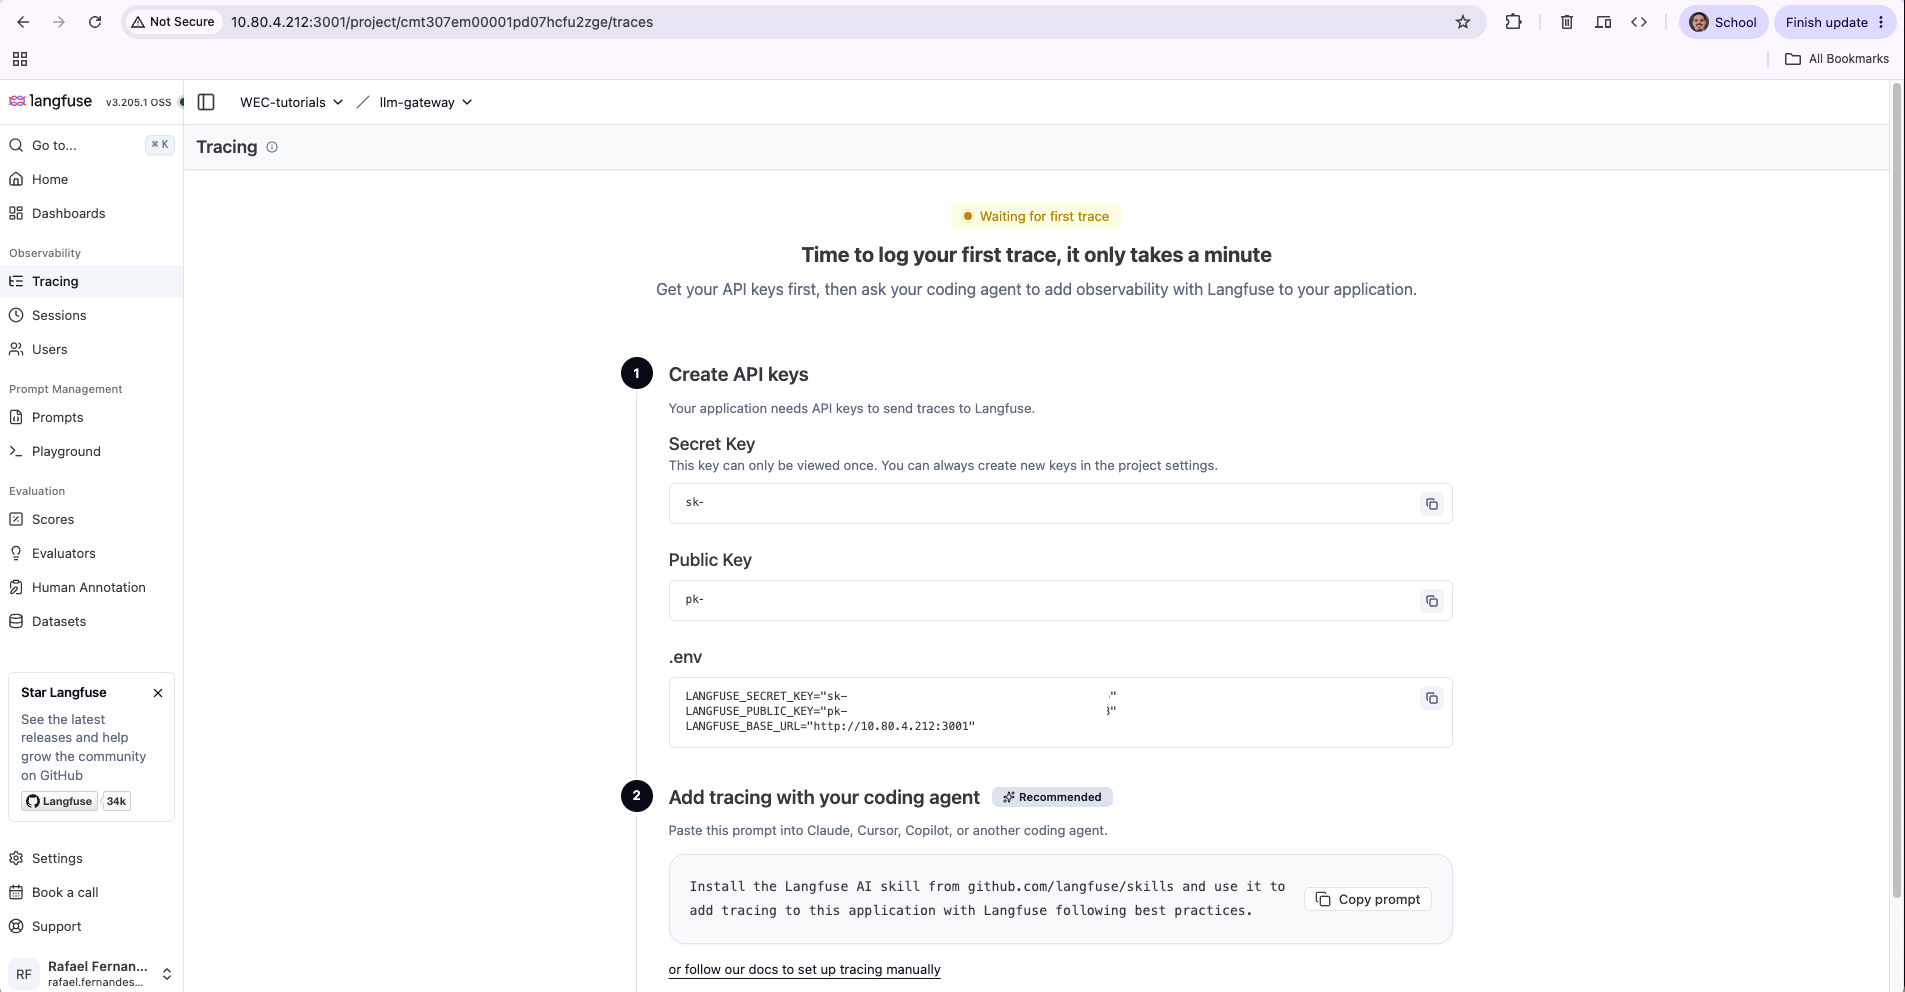
Figure 1. A separate project keeps gateway traffic away from whatever else you are tracing.
Add three variables to the gateway's .env:
LANGFUSE_PUBLIC_KEY=pk-lf-...
LANGFUSE_SECRET_KEY=sk-lf-...
LANGFUSE_HOST=http://your-host:3001
Langfuse's own setup screen prints a .env block containing
LANGFUSE_BASE_URL. The gateway does not read that. It reads:
os.getenv("LANGFUSE_HOST", "https://cloud.langfuse.com")
Copy their snippet verbatim and your host is ignored in favour of the public cloud endpoint — where your self-hosted keys will not authenticate. Traces go nowhere, and nothing errors.
Then turn the callback on:
litellm_settings:
  drop_params: true
  success_callback: ["langfuse"]
  failure_callback: ["langfuse"]
Restarting is not enough
docker compose restart litellm
Send a request after that and the logs say:
Langfuse client is disabled since no public_key was provided as a parameter
or environment variable 'LANGFUSE_PUBLIC_KEY'.
The keys are in .env. They are not in the container:
docker exec llm-gateway printenv | grep -c LANGFUSE
0
restart does not reload env_filedocker compose restart restarts the process inside the container that
already exists, with the environment it was created with. New variables in
.env are not picked up.
The config.yaml change did take effect, because that is a bind-mounted file
read at startup. So the gateway looks correctly configured — callbacks
initialised, no errors — while having no credentials at all.
Use docker compose up -d, which recreates the container.
docker compose up -d
docker exec llm-gateway printenv | grep -c LANGFUSE
3

Figure 2. After up -d, the variables are in the container.
The trace arrives, and the loop closes
Wait for Application startup complete, then send a prompt carrying a name and
an address:
source .env && curl -s http://127.0.0.1:4000/v1/chat/completions \
  -H "Authorization: Bearer $LITELLM_MASTER_KEY" \
  -H "Content-Type: application/json" \
  -d '{"model":"qwen-small","messages":[{"role":"user","content":"What is the first name of Maria Alvarez, and what is the domain of [email protected]? Answer in one short line."}],"max_tokens":40}' \
  | jq -r '.choices[0].message.content'
The first name of Maria Alvarez is Maria; the domain of [email protected] is example.com.
That answer is the control. The model could not have produced "Maria" from a
placeholder, so the live request reached it unmasked — exactly what
logging_only promises.
Now the trace:
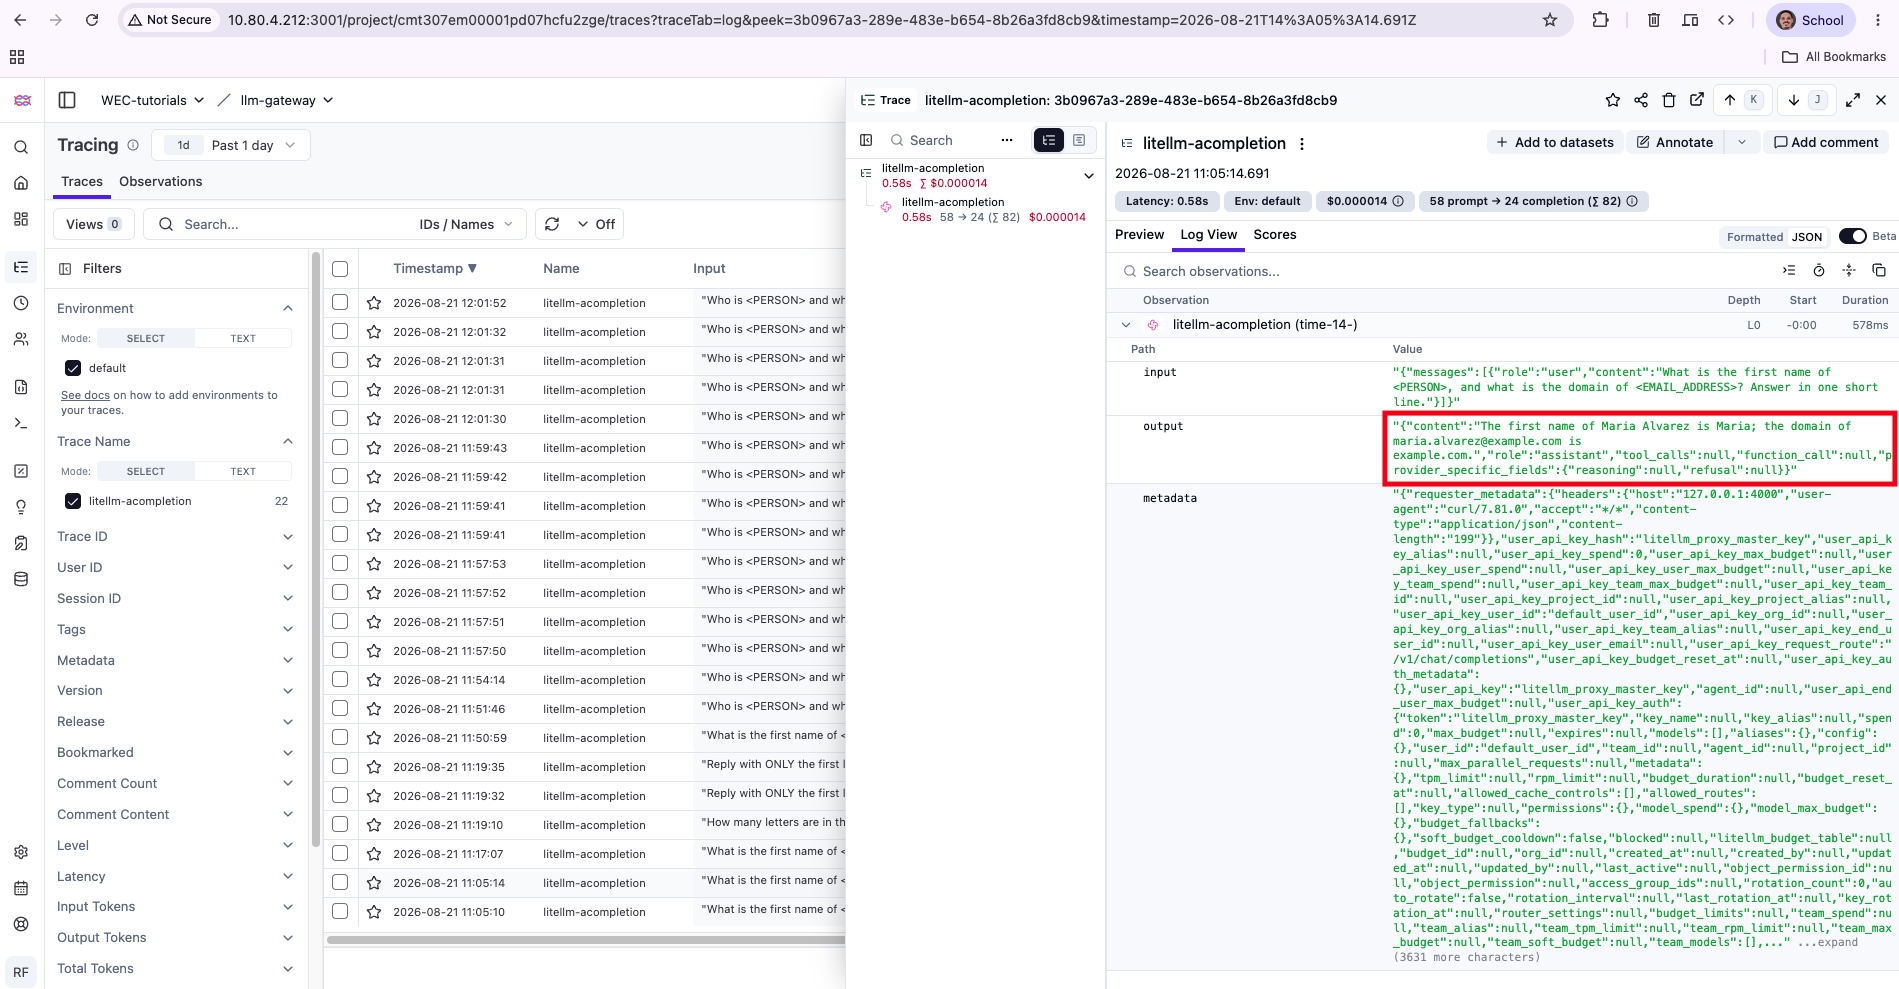
Figure 3. Input masked. Output not.
What is the first name of <PERSON>, and what is the domain of <EMAIL_ADDRESS>?
The first name of Maria Alvarez is Maria; the domain of [email protected] is example.com.
Part 3's job is done — the prompt is masked in the log while the model saw the real text. And the PII is in the trace anyway, because the model repeated it back.
That is not an edge case. Repeating the customer's name is what a support assistant is for.
The spend log is worse
The gateway's own database stores the same request differently again:
curl -s http://127.0.0.1:4000/spend/logs \
  -H "Authorization: Bearer $LITELLM_MASTER_KEY" | jq '.[0] | {messages, response}'
"messages": {}
"response": { ... "content": "The first name of Maria Alvarez is Maria;
              the domain of [email protected] is example.com." ... }
No prompt at all, and the completion in full. Two stores, two shapes, the same hole in both.
Widening the scope trades one problem for another
Part 3 set presidio_filter_scope: input. The obvious fix is to scan both
directions:
presidio_filter_scope: both
Restart, send the identical request, and read the response the caller gets:
The first name of <PERSON> is <PERSON>; the domain of <EMAIL_ADDRESS> is <URL>.
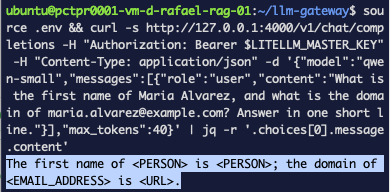
Figure 4. The caller's own terminal, not a log viewer.
That is not the log. That is the answer returned to the client.
mode: logging_only is still set. It did not help, because it never reaches the
output path — the documentation for the scope setting says so directly:
Use
presidio_filter_scope: output(orboth) when you want Presidio to actively scan and mask the model's response before it reaches the user.
Masking the live response is the documented purpose of an output scope. What is
undocumented is the combination: nothing describes what happens when you set
logging_only and an output scope, and the code resolves it in favour of the
live path.
In guardrail_initializers.py:
if run_output:
    output_callback = _make_presidio_callback(
        apply_to_output=True,
        event_hook=GuardrailEventHooks.post_call.value,   # hard-coded
        output_parse_pii=False,
    )
The mode you configured is passed to the input callback. The output callback
gets post_call regardless.
A masked reply has two possible causes: the response was masked on the way out, or the model received placeholders and answered honestly about them. They look identical.
Ask for something that encodes the real value without containing it — a single letter is not PII, so masking cannot hide it:
curl ... -d '{"model":"qwen-small","messages":[{"role":"user","content":"Reply with ONLY the first letter of the first name of Maria Alvarez."}],"max_tokens":200}'
Mª
M. The model had the real name. Only the response was rewritten.
So the two settings give you a choice, and neither is the one you want:
| Logged input | Logged output | Caller's response | |
|---|---|---|---|
filter_scope: input | masked | raw PII | untouched |
filter_scope: both | masked | masked | masked |
This has been reported. Issue #30447 — "logging_only Presidio guardrail corrupts user-facing response" — was filed on 15 June 2026 and closed the next day, with no discussion, alongside a pull request titled "fix(presidio): don't mask the live request when guardrail is logging_only". The report was about the response. The fix addressed the request. #35951 is still open on a related path.
Doing it at logging time instead
The gap exists because post_call runs while the response is still travelling
to the caller. There is a later hook that does not.
async_logging_hook fires after the model has answered and before the loggers
run. It receives the request and the result, and whatever it returns is what
gets logged. The caller already has their response by then.
That hook is documented, under
Scrub Logged Data — but
the example there is a placeholder that replaces every message with the literal
string MASK_THIS_ASYNC_VALUE. It shows the hook exists; it does not mask
anything, it touches only kwargs["messages"], and it mutates in place. What
follows uses the same extension point and adds the parts that make it work:
real Presidio calls, all three places PII hides, and a copy so the caller's
response survives.
The snippet on that page ends return kwargs, responses, but the parameter is
named result. responses is undefined, so copying it verbatim raises
NameError.
Create scrubber.py next to config.yaml:
import copy
import os
from typing import Any, Tuple

import httpx
from litellm.integrations.custom_logger import CustomLogger

ANALYZER = os.getenv("PRESIDIO_ANALYZER_API_BASE", "http://presidio-analyzer:3000")
ANONYMIZER = os.getenv("PRESIDIO_ANONYMIZER_API_BASE", "http://presidio-anonymizer:3000")


async def _mask(text: str) -> str:
    if not text or not text.strip():
        return text
    async with httpx.AsyncClient(timeout=10.0) as client:
        r = await client.post(f"{ANALYZER}/analyze", json={"text": text, "language": "en"})
        found = r.json()
        if not found:
            return text
        r = await client.post(
            f"{ANONYMIZER}/anonymize",
            json={"text": text, "analyzer_results": found},
        )
        return r.json()["text"]


class PresidioLogScrubber(CustomLogger):
    async def async_logging_hook(
        self, kwargs: dict, result: Any, call_type: str
    ) -> Tuple[dict, Any]:
        if call_type not in ("completion", "acompletion"):
            return kwargs, result

        kwargs = copy.deepcopy(kwargs)

        for message in kwargs.get("messages") or []:
            if isinstance(message.get("content"), str):
                message["content"] = await _mask(message["content"])

        slo = kwargs.get("standard_logging_object")
        if isinstance(slo, dict):
            for message in slo.get("messages") or []:
                if isinstance(message, dict) and isinstance(message.get("content"), str):
                    message["content"] = await _mask(message["content"])
            response = slo.get("response")
            if isinstance(response, dict):
                for choice in response.get("choices") or []:
                    message = (choice or {}).get("message") or {}
                    if isinstance(message.get("content"), str):
                        message["content"] = await _mask(message["content"])

        # `result` is the object the caller already holds. Copy before masking.
        logged_result = copy.deepcopy(result)
        for choice in getattr(logged_result, "choices", None) or []:
            message = getattr(choice, "message", None)
            if message is not None and isinstance(getattr(message, "content", None), str):
                message.content = await _mask(message.content)

        return kwargs, logged_result


instance = PresidioLogScrubber()
Three details carry the whole thing.
PII hides in three places, not one. kwargs["messages"] is the prompt.
kwargs["standard_logging_object"] is what the logging integrations actually
read — this is the subject of issue #35951. And result holds the completion.
Miss any one and something leaks.
result is the caller's object. Mutating it in place reproduces the bug we
are working around. It gets deep-copied first, and the copy is what we mask and
return.
_mask is async on purpose. More on that below, because getting it wrong
costs measurable latency.
Mount the file and register it. It must sit beside config.yaml, because
get_instance_fn resolves the dotted path relative to the config file's
directory:
    volumes:
      - ./config.yaml:/app/config.yaml:ro
      - ./scrubber.py:/app/scrubber.py:ro
litellm_settings:
  drop_params: true
  callbacks: ["scrubber.instance"]
  success_callback: ["langfuse"]
Set the built-in guardrail to default_on: false while testing. If both it and
the callback are masking, you cannot tell which did the work.
Adding a volume changes the container definition, so this needs a recreate, not a restart:
docker compose up -d
Proving it, on both sides of one request
Send a request and keep the response body:
curl -s http://127.0.0.1:4000/v1/chat/completions \
  -H "Authorization: Bearer $LITELLM_MASTER_KEY" \
  -H "Content-Type: application/json" \
  -d '{"model":"qwen-small","messages":[{"role":"user","content":"Who is Priya Raghunathan and what is the domain of [email protected]? One short line."}],"max_tokens":40}' \
  -o response.json
What the caller received:
jq -r '.choices[0].message.content' response.json
Priya Raghunathan is an AI researcher, and the domain
[email protected] is likely a personal email address.
What Langfuse stored:
curl -s -u "$LANGFUSE_PUBLIC_KEY:$LANGFUSE_SECRET_KEY" \
  "http://your-host:3001/api/public/traces?limit=1" -o trace.json
jq -r '.data[0].output.content' trace.json
<PERSON> is an AI researcher, and the domain <EMAIL_ADDRESS> is likely a
personal email address.
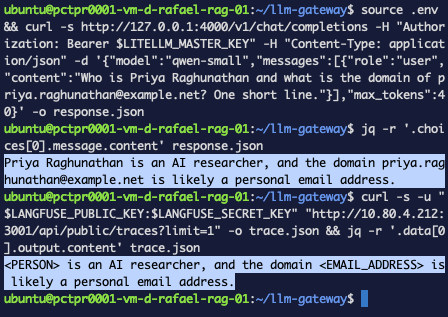
Figure 5. Same sentence. One real, one masked.
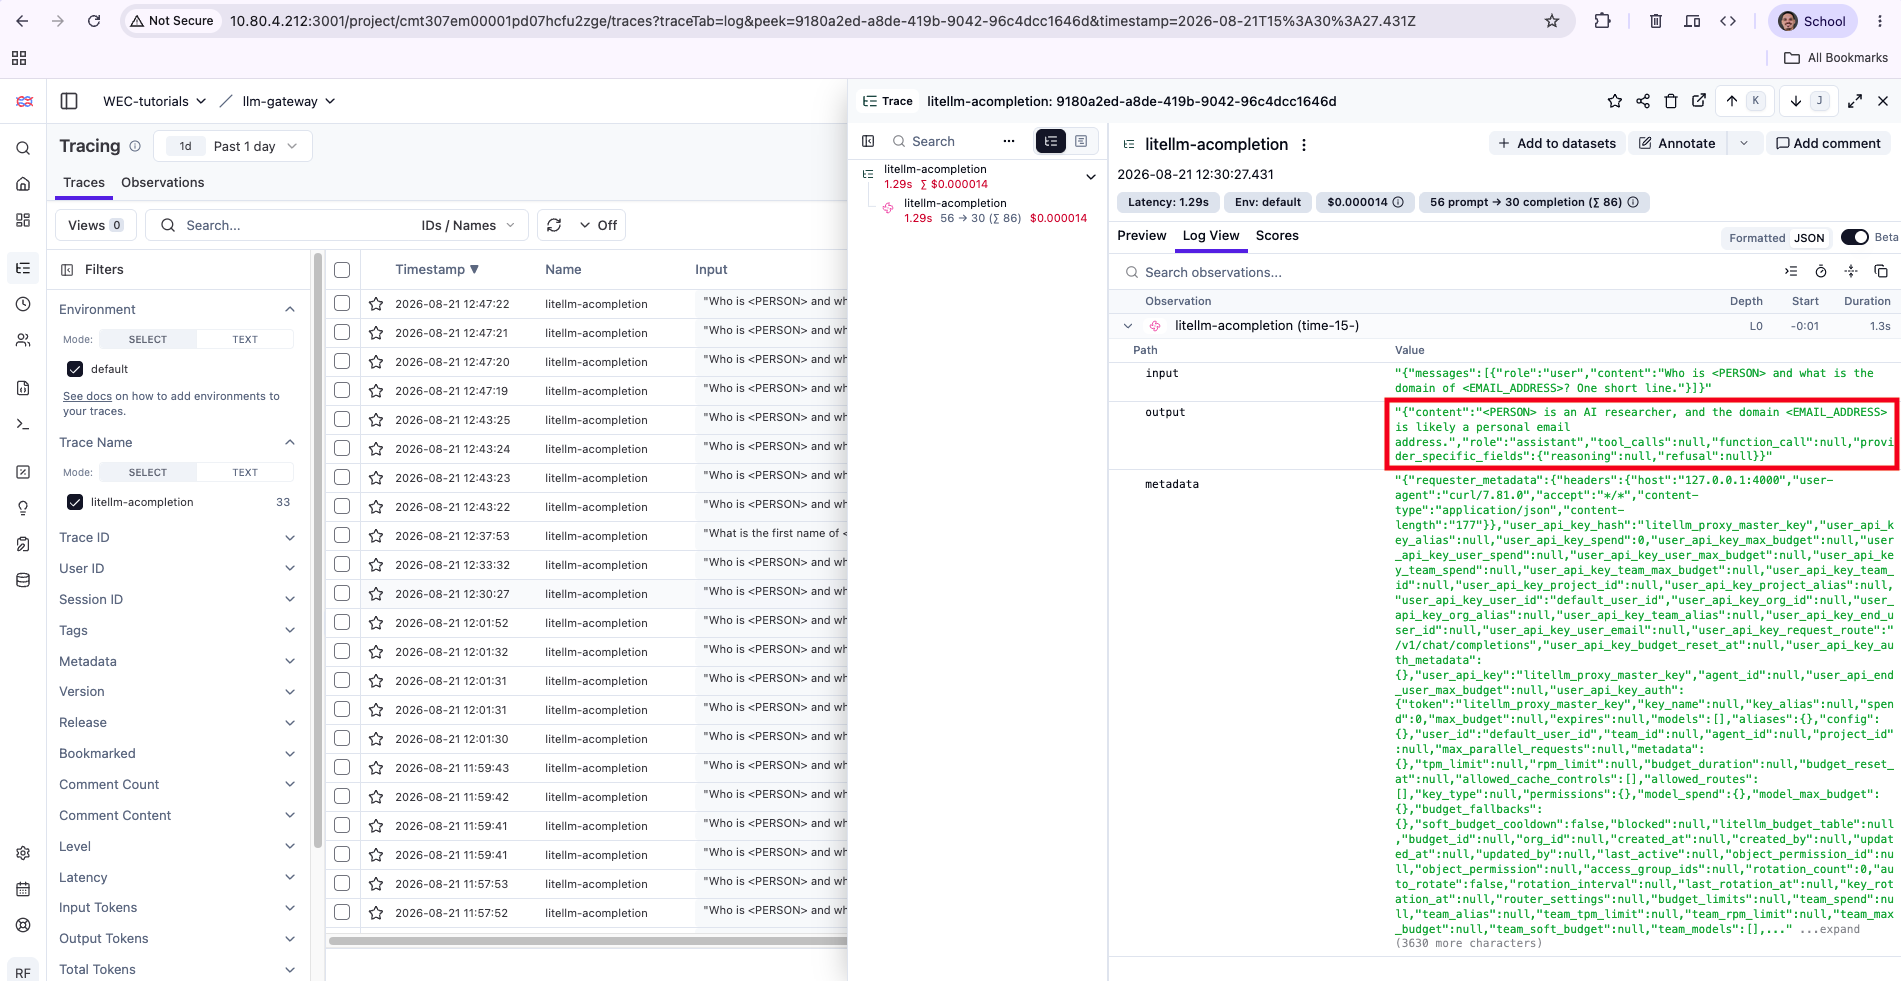
Figure 6. Masked on both sides of the trace, untouched for the caller.
Reading a rendered UI proves less than checking the payloads, so check them:
grep -c "Priya Raghunathan" response.json
grep -c "Priya Raghunathan" trace.json
grep -o "PERSON" trace.json | wc -l
grep -c "One short line" trace.json
1
0
2
1
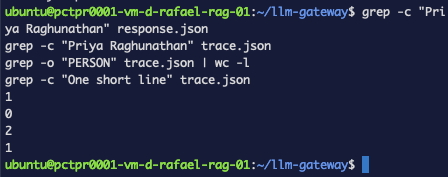
Figure 7. The receipt: 1 0 2 1.
The real name is in what the caller received. It is not in the trace. The placeholder appears twice — input and output. And the last line proves both files describe the same request, which the first three do not establish on their own.
You can mask what a gateway logs without changing what it returns, and prove it by inspecting the raw payloads on both sides of a single request.
The version that quietly costs you 200-350ms
The first working version of _mask used a blocking client — httpx.Client
inside an async def. It masked correctly. It also did this:
| run 1 | run 2 | |
|---|---|---|
| no callback | 0.74 s | — |
blocking httpx.Client | 1.10 s | 0.97 s |
async httpx.AsyncClient | 0.77 s | 0.77 s |
Warm medians, four sequential requests each, first discarded as cold. The async figure repeated exactly; the blocking one did not, which is itself the point — the penalty depends on what else the loop is doing.
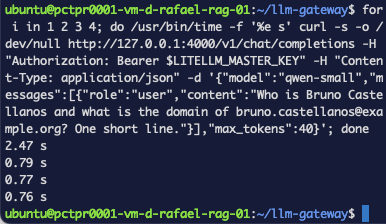
Figure 8. Same request, same masking, one word different in the code.
A blocking HTTP call inside an async hook stalls the event loop until Presidio answers, and each request makes several such calls. The masking is not on the caller's critical path — but it is on everyone else's, because nothing else can be serviced while it waits.
Changing httpx.Client to httpx.AsyncClient and awaiting the calls removes
the cost: 0.77s against a 0.74s baseline, inside the noise of the model call
itself, and it reproduced to the hundredth across two separate runs.
These numbers are four sequential requests. Blocking the event loop barely shows at one request at a time — it is under concurrency that the two versions diverge, and we have not measured that here. If you run this at volume, load test it before trusting the table above.
Each request also means two Presidio HTTP calls per message plus two for the completion. At real volume Presidio becomes a service you size and monitor, not a background detail.
Where this leaves you
| Logged input | Logged output | Caller's response | Cost | |
|---|---|---|---|---|
filter_scope: input | masked | raw PII | untouched | none |
filter_scope: both | masked | masked | masked | 0.30s guardrail span |
| logging hook | masked | masked | untouched | none measurable |
Worth being clear about the limit of what this achieves: the PII still travels. It reaches the model and it reaches the caller. What has been eliminated is retention — it is no longer sitting in a trace store that a wider group of people can read, months later, long after the request itself is gone.
Verified against ghcr.io/berriai/litellm:main-stable, admin UI reporting
v1.96.2, on 21 August 2026. If a later release adds a logging-scoped output
mode, prefer it over this.
Troubleshooting
Traces never appear and nothing errors
Check LANGFUSE_HOST is set, not LANGFUSE_BASE_URL, and confirm the variables
are inside the container with docker exec llm-gateway printenv | grep LANGFUSE.
A docker compose restart will not have loaded them.
The callback does not run and the gateway starts normally
A bad dotted path fails quietly. scrubber.py must sit in the same directory as
config.yaml — inside the container, not just on the host — and the object name
after the dot must exist. Grep the startup log for ImportError and
AttributeError.
The response comes back masked
The deep copy is missing, or the built-in guardrail is still enabled with an
output scope. Set default_on: false on it and confirm with
curl /guardrails/list.
Everything got slower
Check _mask uses httpx.AsyncClient with await, not httpx.Client. See the
measurements above.
What's next
The measurements here are sequential, and the failure mode that cost 200-350ms is one that only bites properly under concurrency. The next post puts the gateway under parallel load and measures what actually happens to latency when several requests contend for the same event loop.
Further reading
- PII, PHI Masking — Presidio
- Scrub Logged Data — the documented hook this post builds on
- Part 3 — mask PII at the gateway