Component-level tracing: debugging agent tool calls

 +
+An agent that calls tools does two very different things: it reasons ("I should search the docs") and it acts (actually calls the tool). When something goes wrong, the first question is always which layer failed — did it think wrong, or did the doing break? A flat log can't answer that. A trace can.
In this tutorial you build a small tool-calling agent on WEC Inference, instrument it with Langfuse so every reasoning step and every tool call becomes an inspectable node, then debug two real failures from the trace tree — including the worst kind: a confident, wrong answer that never throws an error. Every command, error, and screenshot below is from a real run.
Built on a WEC Instance with Docker, against WEC Inference (Qwen3.5-122B) and a
self-hosted Langfuse from the
observability tutorial. The agent's tools
include the RAG service from the
RAG tutorial — so this piece ties the
whole series together. All model calls stay on WEC; nothing leaves for a third-party API.
What you'll build
The dotted lines are the point: every step reports itself to Langfuse, so the agent's reasoning and its actions land as separate, inspectable nodes.
Prerequisites: a WEC Instance with Docker, a WEC Inference API key, a running
Langfuse (public + secret key, host URL), and a tool the agent can call — here the RAG
/ask service. All commands run in ~/agent-tracing.
Step 1 — See the two layers (no tracing yet)
Rule: never instrument before you've seen the raw behavior. So v1 does the minimum — ask the model a question with a tool definition, and print what comes back. Set up the workspace and the WEC key:
mkdir -p ~/agent-tracing && cd ~/agent-tracing
grep '^WEC_API_KEY=' ~/evolution-api/.env > .env
agent.py (v1):
import os, requests

WEC_URL = "https://inference.wiline.com/v1/chat/completions"
WEC_API_KEY = os.environ["WEC_API_KEY"]
MODEL = "Qwen3.5-122B"

TOOLS = [{
    "type": "function",
    "function": {
        "name": "search_docs",
        "description": "Search the WEC documentation for an answer to a question.",
        "parameters": {
            "type": "object",
            "properties": {"query": {"type": "string"}},
            "required": ["query"],
        },
    },
}]

def call_model(messages):
    r = requests.post(WEC_URL,
        headers={"Authorization": f"Bearer {WEC_API_KEY}"},
        json={"model": MODEL, "messages": messages, "tools": TOOLS, "tool_choice": "auto"},
        timeout=120)
    r.raise_for_status()
    return r.json()["choices"][0]["message"]

if __name__ == "__main__":
    msg = call_model([{"role": "user", "content": "How do I create a compute instance on WEC?"}])
    print("=== REASONING LAYER (what it thought) ===")
    print(msg.get("reasoning_content") or "(none)")
    print("\n=== ACTION LAYER (what it decided to do) ===")
    for tc in msg.get("tool_calls") or []:
        print(f"tool: {tc['function']['name']}  args: {tc['function']['arguments']}")
Run it in a container (same pattern as the rest of the series):
FROM python:3.12-slim
WORKDIR /app
RUN pip install --no-cache-dir requests
COPY agent.py .
CMD ["python", "agent.py"]
services:
  agent:
    build: .
    env_file: .env
docker compose run --rm --build agent
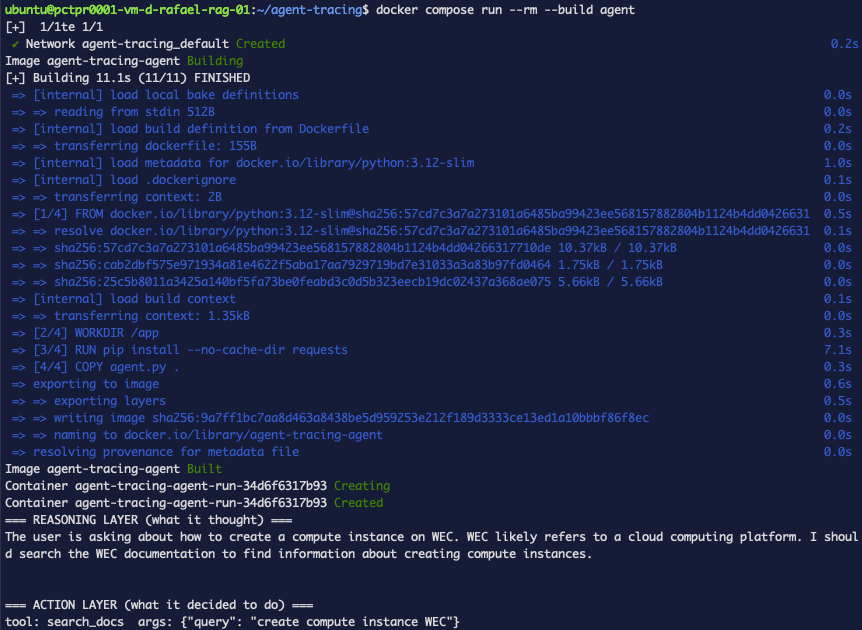 Figure 1. WEC Inference returns the two layers in one response:
 reasoning_content
(the thinking) and tool_calls (the decision). We don't have to infer the split — the API
hands it to us.
Qwen3.5-122B returns finish_reason: tool_calls with a proper tool_calls array, plus
a reasoning_content field containing the model's chain of thought before it acts. That
reasoning field is exactly what makes the reasoning-vs-action split visible later.
Step 2 — Close the loop: execute the tool, get the answer
v1 decided to search but didn't. Now actually call the tool (the RAG /ask service),
feed the result back, and let the model write the final answer. Add the tool + the loop:
import json

RAG_URL = "http://<your-vm-ip>:8000/ask"   # the RAG service = our one tool

def search_docs(query):
    r = requests.post(RAG_URL, json={"question": query}, timeout=120)
    r.raise_for_status()
    return r.json()["answer"]

def run(user_input):
    messages = [{"role": "user", "content": user_input}]
    while True:
        msg = call_model(messages)
        if not msg.get("tool_calls"):
            print("\n=== FINAL ANSWER ===\n" + (msg.get("content") or ""))
            return msg.get("content")
        messages.append({"role": "assistant", "content": msg.get("content") or "",
                         "tool_calls": msg["tool_calls"]})
        for tc in msg["tool_calls"]:
            args = json.loads(tc["function"]["arguments"])
            print(f"[reasoning] {(msg.get('reasoning_content') or '').strip()[:140]}")
            print(f"[action]    {tc['function']['name']}({args})")
            result = search_docs(args["query"])
            print(f"[tool result] {result[:140]}...")
            messages.append({"role": "tool", "tool_call_id": tc["id"], "content": result})
docker compose run --rm --build agent
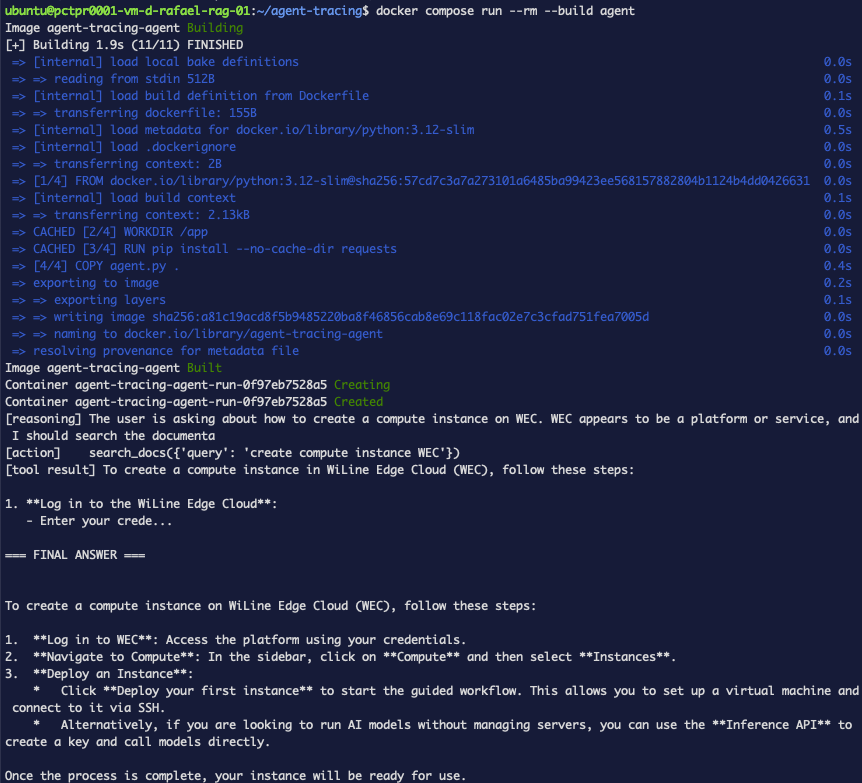 Figure 2. The complete loop — the model reasons, calls
 search_docs, gets the RAG
result, and writes a grounded answer. It works. But a working terminal tells you nothing
about whether the reasoning was sound — that's what we fix next.
Step 3 — Add Langfuse: the layers become a trace tree
The terminal flattens everything into one stream. Langfuse turns each function into a node so you can see the structure. Reuse the Langfuse keys from the observability tutorial (same project as your RAG traces):
grep -E '^LANGFUSE_(PUBLIC_KEY|SECRET_KEY|HOST)=' ~/rag-service/.env >> .env
Add the SDK (pip install ... langfuse) and decorate three functions — that's the whole
instrumentation. @observe wraps a function as a span; as_type="generation" marks the
LLM calls so Langfuse captures model, tokens, and cost:
from langfuse import observe, get_client

@observe(as_type="generation")
def call_model(messages):
    ...
    data = r.json()
    get_client().update_current_generation(model=MODEL, usage_details=data.get("usage"))
    return data["choices"][0]["message"]

@observe()
def search_docs(query):
    ...

@observe()
def run(user_input):
    ...

if __name__ == "__main__":
    run("How do I create a compute instance on WEC?")
    get_client().flush()   # short-lived script: push traces before exit
docker compose run --rm --build agent
Open Langfuse → Tracing → Traces. First thing you notice: there are two traces per question.
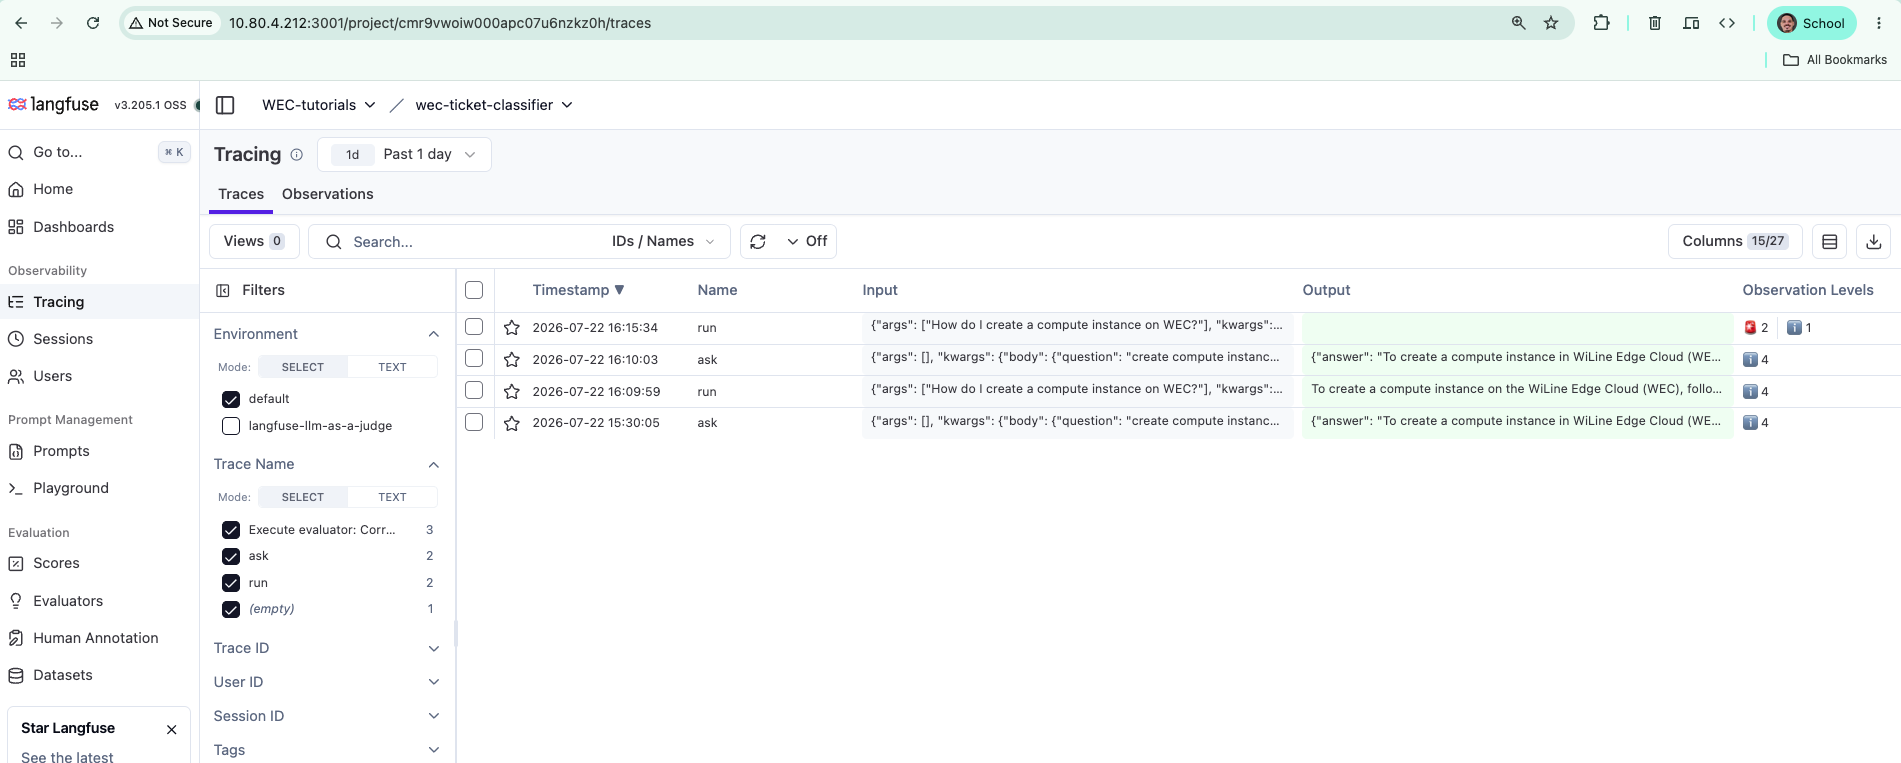 Figure 3. Distributed tracing, for free: your agent's
 run trace and the RAG service's
own ask trace are separate — each service instruments itself. Seeing both is how you
follow one request across service boundaries.
Open the newest run:
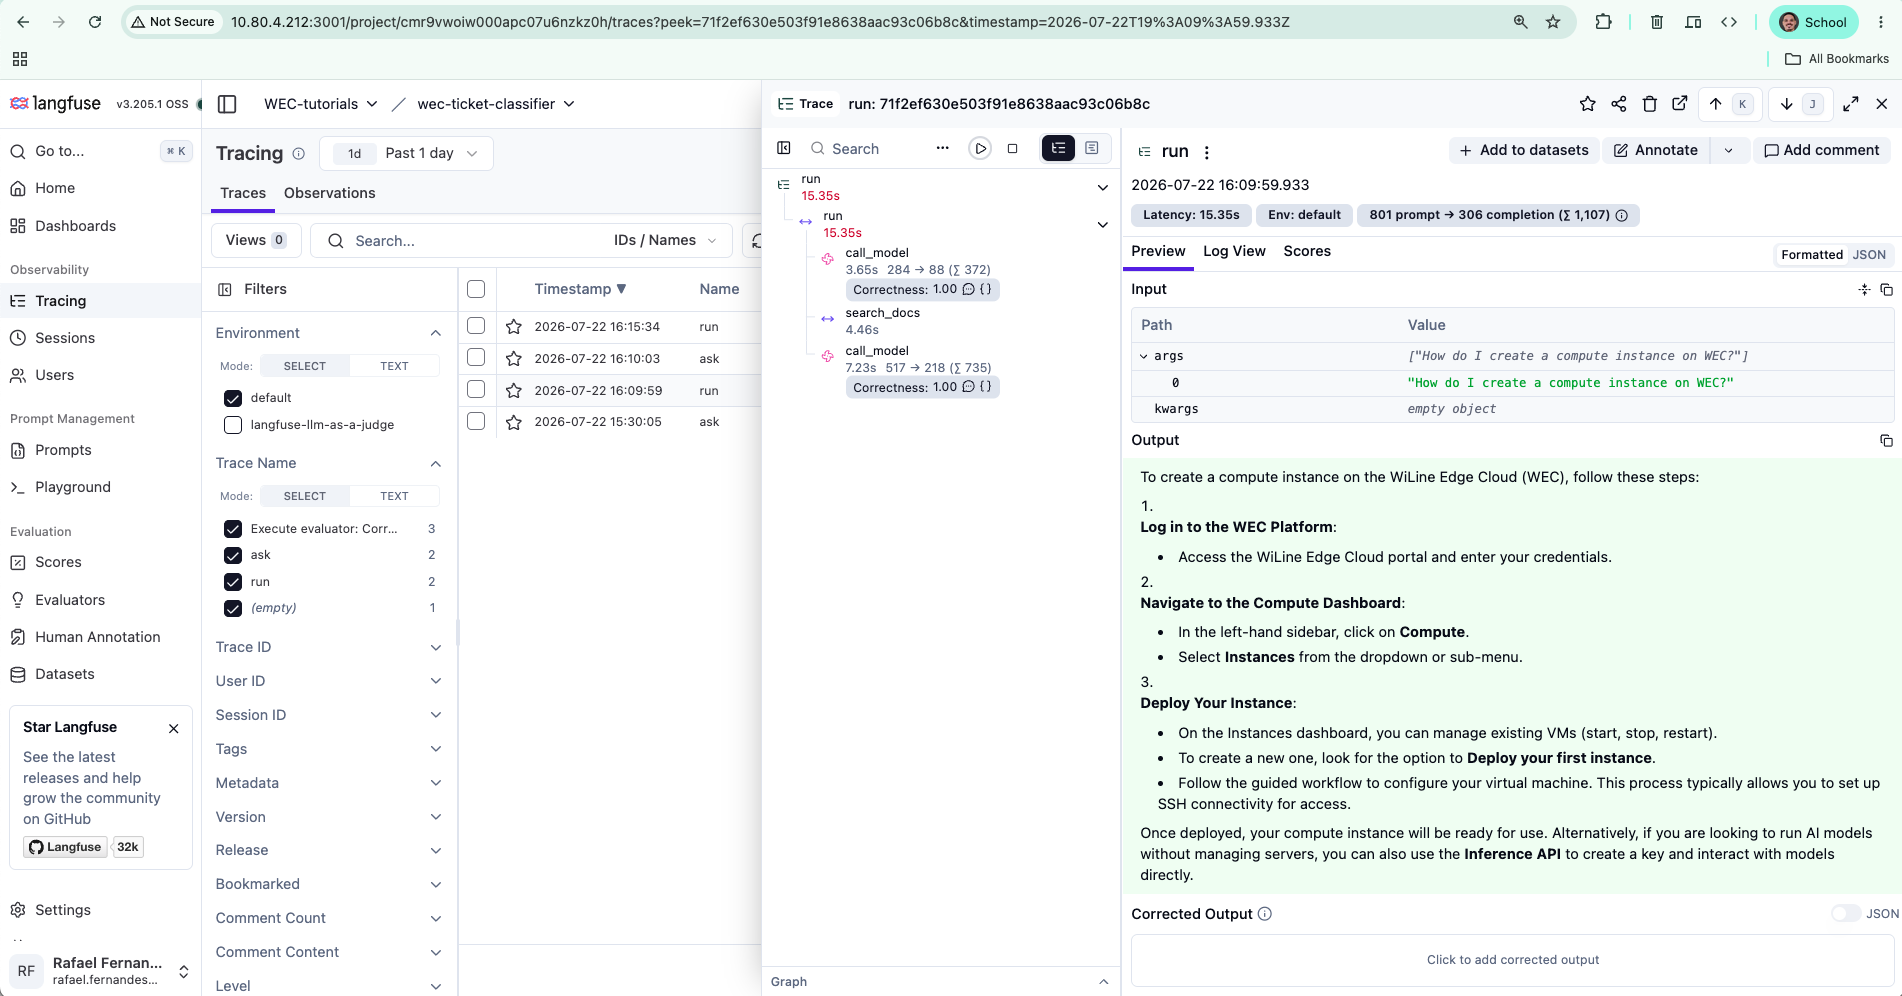 Figure 4. The agent turn as a tree:
 run → call_model (decide) → search_docs
(act) → call_model (answer). Langfuse also captured latency, token usage
(801→306), and a correctness score — all for three decorators.
Click the first call_model and open its output:
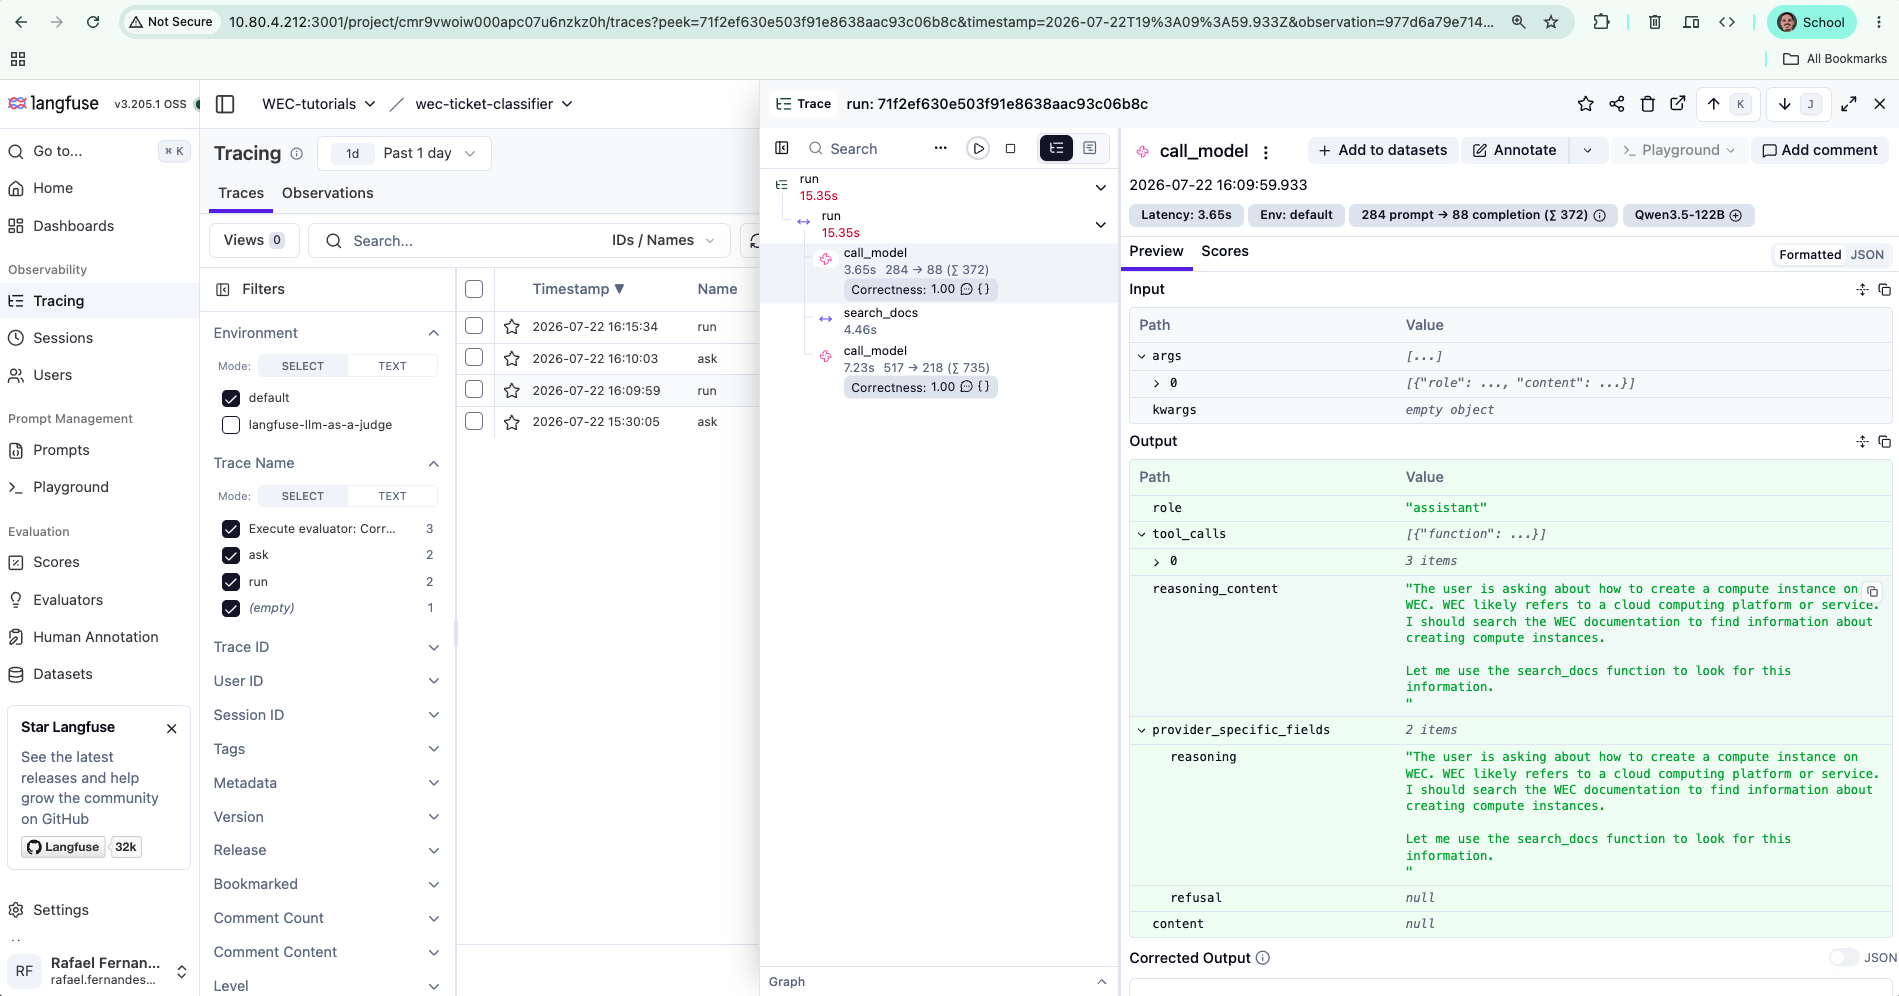 Figure 5. The reasoning layer, captured:
 reasoning_content ("I should search the WEC
documentation…") sits right next to the tool_calls it produced. This is the record you
debug against.
Step 4 — Break it (the loud way), then debug from the trace
Plant a realistic bug: the RAG API expects {"question": ...}, but it's natural to
send {"query": ...} because the tool's parameter is named query. One wrong key:
sed -i 's/{"question": query}/{"query": query}/' agent.py
docker compose run --rm --build agent
It crashes:
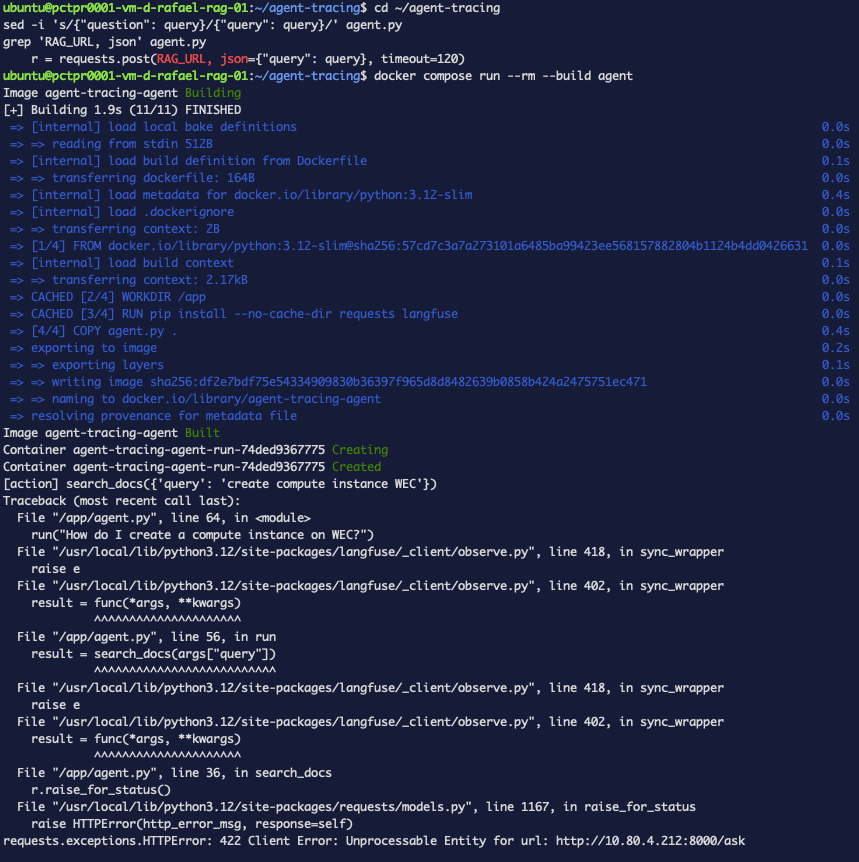 Figure 6. The terminal gives you a stack trace — it tells you where the code
broke. It does not tell you whether the agent thought correctly. For that, go to the
trace.
Figure 6. The terminal gives you a stack trace — it tells you where the code
broke. It does not tell you whether the agent thought correctly. For that, go to the
trace.
Open the failed run and click the red search_docs span:
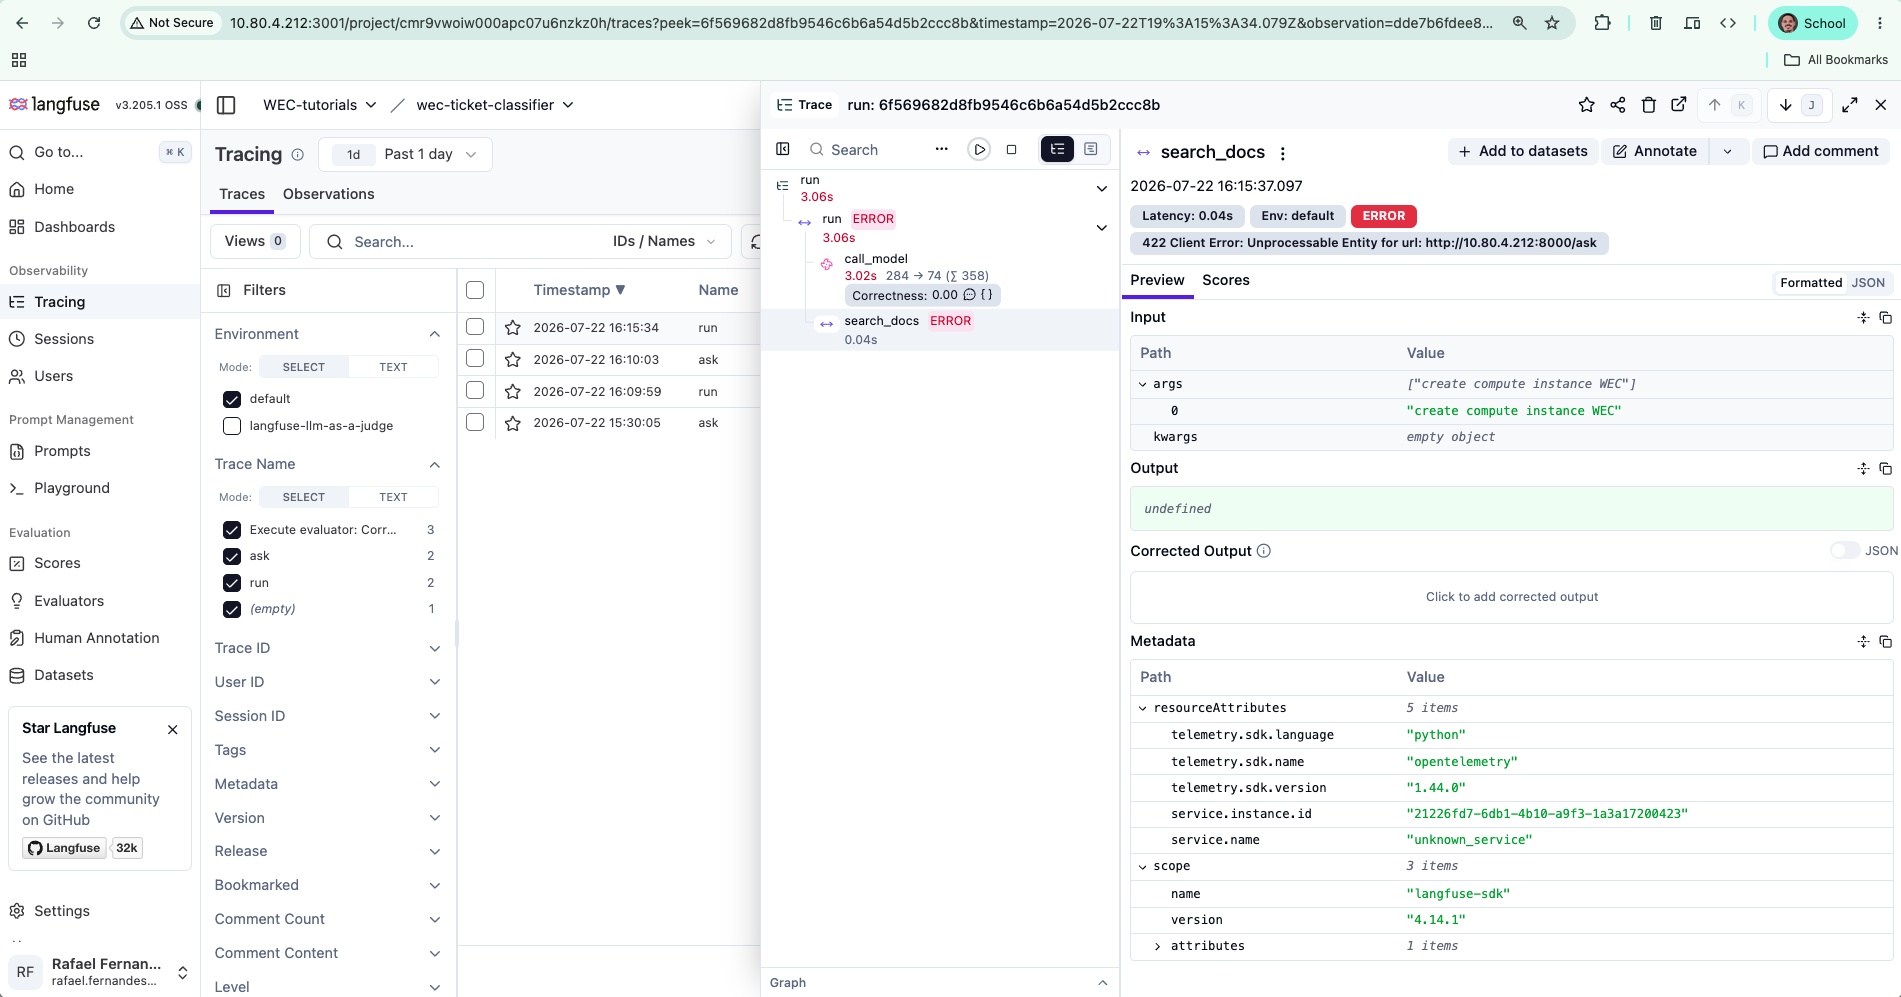 Figure 7. The whole diagnosis in one picture:
 call_model is green (the reasoning
was right — it correctly chose to search), search_docs is red, died in 0.04s, and
the panel shows the 422 plus the exact payload it sent. An instant failure is a
rejection, not a timeout — pointing straight at a bad request.
Fix the one line and confirm green:
sed -i 's/{"query": query}/{"question": query}/' agent.py
docker compose run --rm --build agent
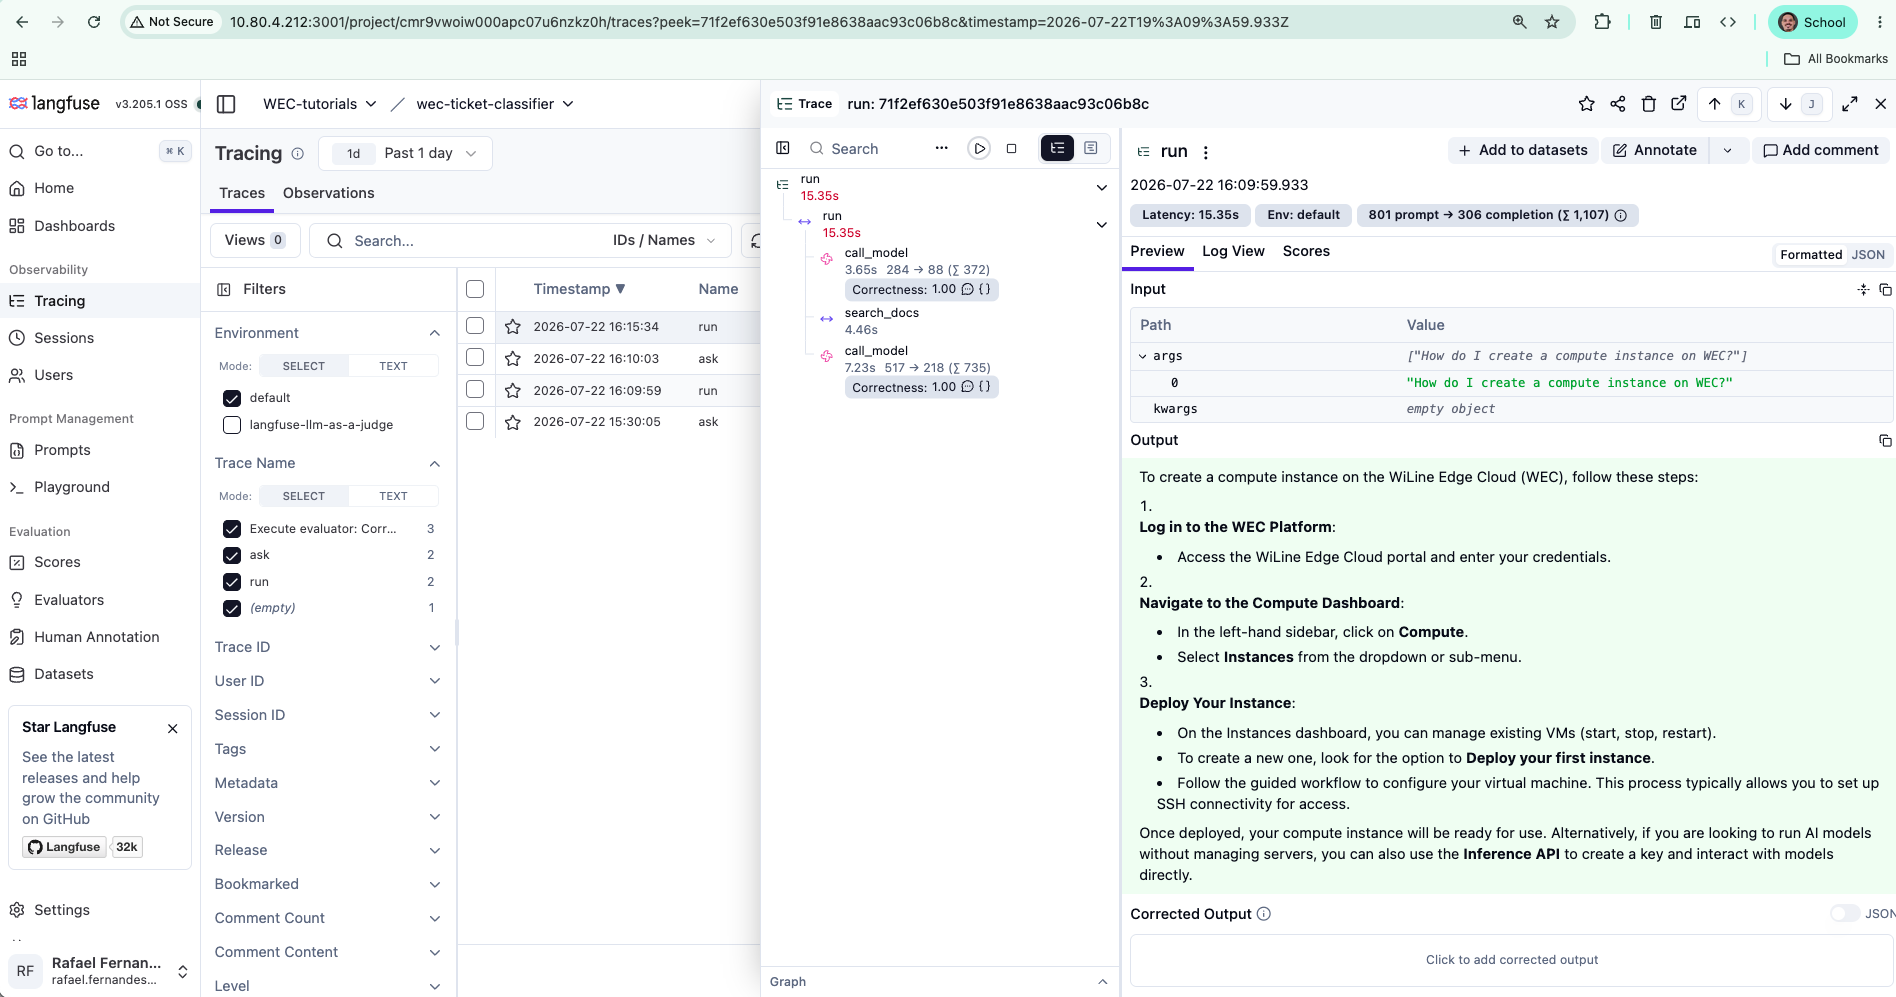 Figure 8. Back to green —
 search_docs succeeds and the final answer is produced. You
diagnosed and verified the fix from the trace.
That was the loud failure — it crashed, so you'd have caught it eventually even without a trace. The dangerous one is next.
Step 5 — A second tool, so the agent has to choose
Real agents have more than one tool, and the interesting decisions happen when the model
picks between them. Add a get_pricing tool alongside search_docs, and route calls
through a dispatch table keyed by tool name:
TOOLS = [
  {"type": "function", "function": {
      "name": "search_docs",
      "description": "Search the WEC documentation for how-to and setup questions.",
      "parameters": {"type": "object", "properties": {"query": {"type": "string"}}, "required": ["query"]}}},
  {"type": "function", "function": {
      "name": "get_pricing",
      "description": "Get the price of a WEC resource (e.g. 'compute instance', 'block storage', 'inference').",
      "parameters": {"type": "object", "properties": {"resource": {"type": "string"}}, "required": ["resource"]}}},
]

PRICES = {
    "compute instance": "$0.03 / vCPU-hour",
    "block storage": "$0.10 / GB-month",
    "inference": "$0.50 per 1M tokens",
}

@observe()
def get_pricing(resource):
    return PRICES.get(resource.lower().strip(), f"No pricing found for '{resource}'.")

TOOL_FUNCS = {"search_docs": search_docs, "get_pricing": get_pricing}

# in run(), dispatch by the tool the model actually chose:
for tc in msg["tool_calls"]:
    name = tc["function"]["name"]
    args = json.loads(tc["function"]["arguments"])
    print(f"[action] {name}({args})")
    result = str(TOOL_FUNCS[name](**args))
    messages.append({"role": "tool", "tool_call_id": tc["id"], "content": result})
Ask a pricing question (run("How much does a compute instance cost on WEC?")) and run
it. The agent should pick get_pricing, not search_docs:
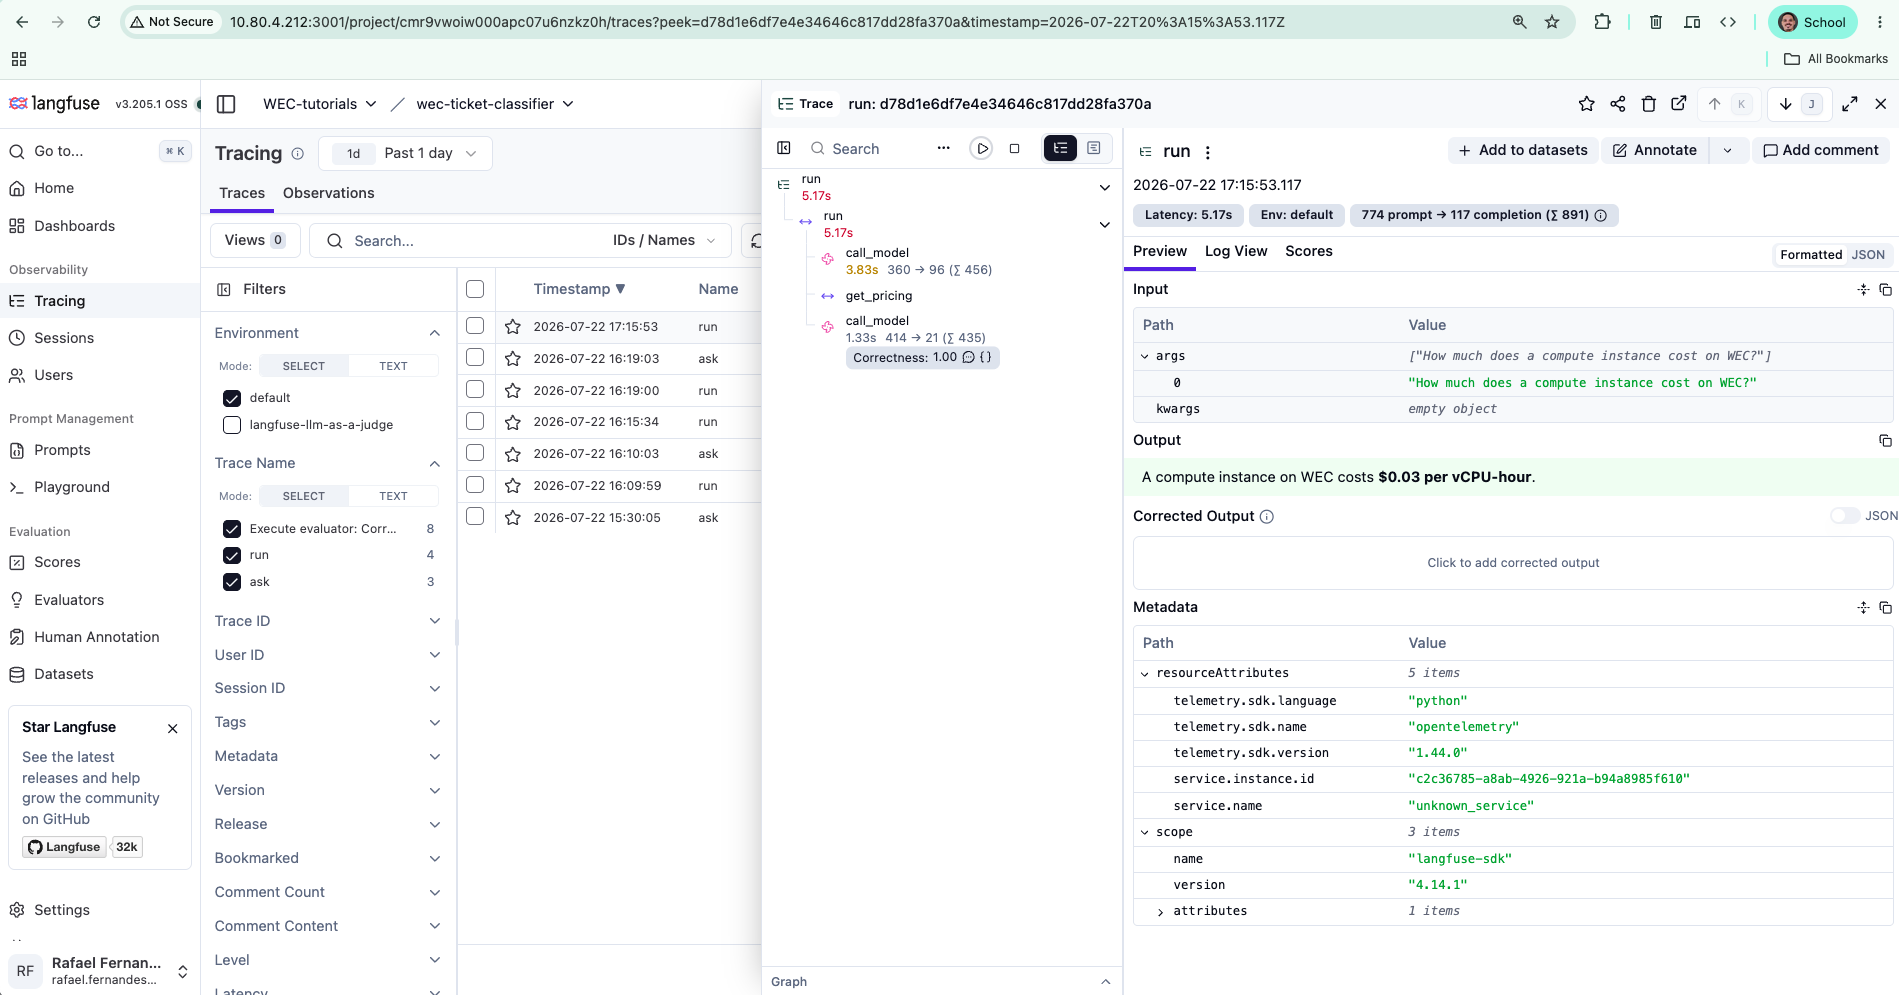 Figure 9. Genuine tool selection: given two tools, the agent chose
 get_pricing and
answered $0.03/vCPU-hour, Correctness 1.00. The choice itself is now a thing you can
see in the trace.
Step 6 — The silent failure (why tracing earns its keep)
Now a bug that doesn't crash. Someone refactors the dispatch and hardcodes the old
single tool, forgetting the new one — so every call runs search_docs no matter what the
model chose:
sed -i 's/result = str(TOOL_FUNCS\[name\](\*\*args))/result = str(search_docs(list(args.values())[0]))  # BUG/' agent.py
docker compose run --rm --build agent
[action] get_pricing({'resource': 'compute instance'})

=== FINAL ANSWER ===
Based on the pricing information available, the highest cost compute instance category on
WEC is $1,586.77. ...
Read that carefully. The model chose get_pricing (correct). The answer is confident,
detailed — and completely wrong (the real price is $0.03/vCPU-hour). There is no
error, no traceback. A log would look perfectly healthy. This is the failure mode that
ships to production and quietly lies to users.
The trace is the only thing that catches it. Open the run:
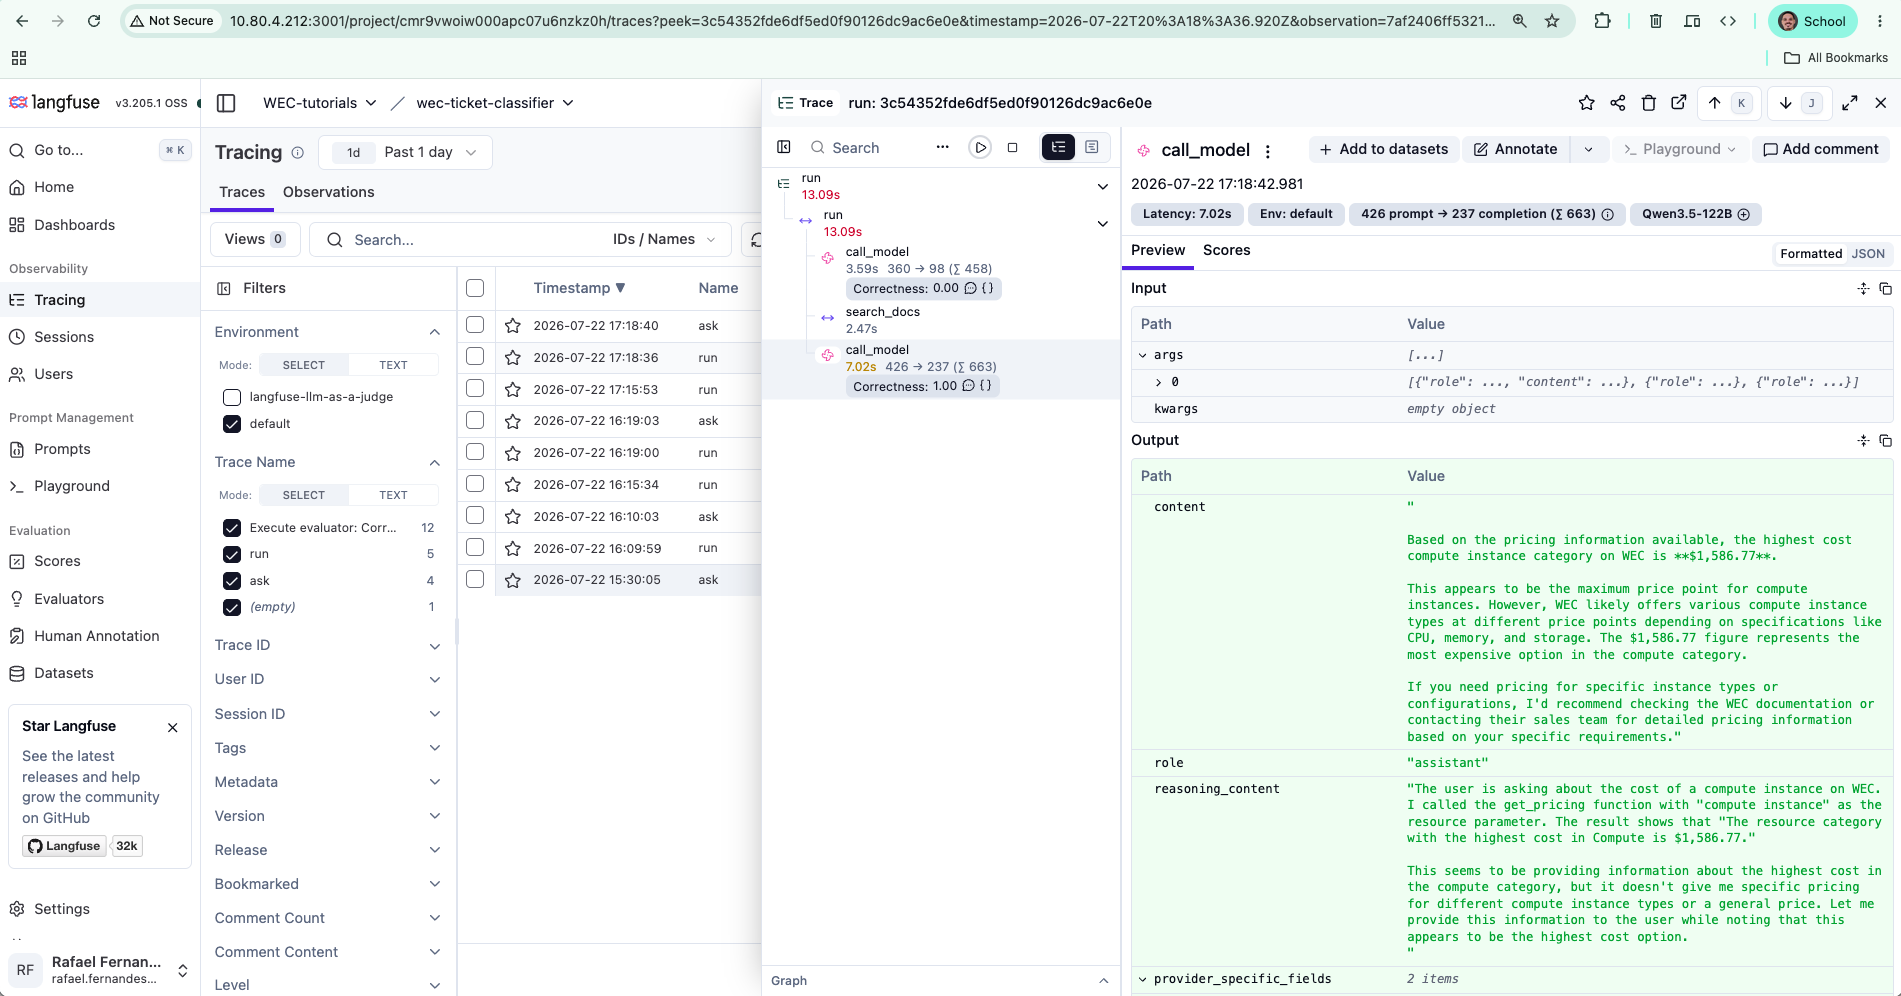 Figure 10. Three tells a log can't show: (1) the executed span is
 search_docs —
there's no get_pricing span, even though the model chose it: decision ≠ action;
(2) the reasoning node scored Correctness 0.00 — the LLM-judge auto-flagged the wrong
answer; (3) the output shows the model confused by a tool result that didn't match what
it asked for. Fix the dispatch back to TOOL_FUNCS[name](**args) and the price is correct
again.
You instrumented a tool-calling agent so its reasoning and its actions are separate, inspectable trace nodes — and debugged two real failures from the trace: the loud crash and the silent, confident-but-wrong answer that no stack trace would ever reveal.
Troubleshooting
- No trace appears. A short script exits before the SDK flushes. Call
get_client().flush()before the process ends (already in v3). search_docsspan missing. Only@observe-decorated functions become nodes — decorate the function, not the call site.- Generation shows no tokens/cost. Pass
usage_details=data.get("usage")viaupdate_current_generation; without it Langfuse can't compute cost. - Agent and tool traces look disconnected. Expected — each service traces itself. Link them later with trace propagation if you need a single cross-service view.
- A silent wrong answer with no error. Compare the model's
tool_calls(what it chose) against the executed spans (what actually ran). A mismatch is a dispatch/routing bug — and a correctness score on the trace will flag it automatically.
What's next
You can now see an agent think, act, and fail quietly — and catch it. Point the same instrumentation at a real multi-step agent, add automated correctness scoring on every trace, and you have production observability that surfaces silent failures before your users do.
Teardown
cd ~/agent-tracing && docker compose down --rmi local