Manage Virtual Machines
This guide provides detailed instructions on how to manage your virtual machines (VMs) in WiLine Edge Cloud (WEC), including starting, stopping, monitoring, and troubleshooting.
From the Compute Instances dashboard, you can:
- View a list of your VMs and their statuses.
- Start, stop, or restart VMs.
- Access detailed management pages for each VM.
How to Manage a VM
Manage your VM in WiLine Edge Cloud with these simple steps:
Step 1: Access the VM Dashboard
- Log in to the WiLine Edge Cloud.
- In the sidebar, click Compute.
- Select Instances.
You will see a table listing all your VMs, including their status, OS, zone, and public IP.
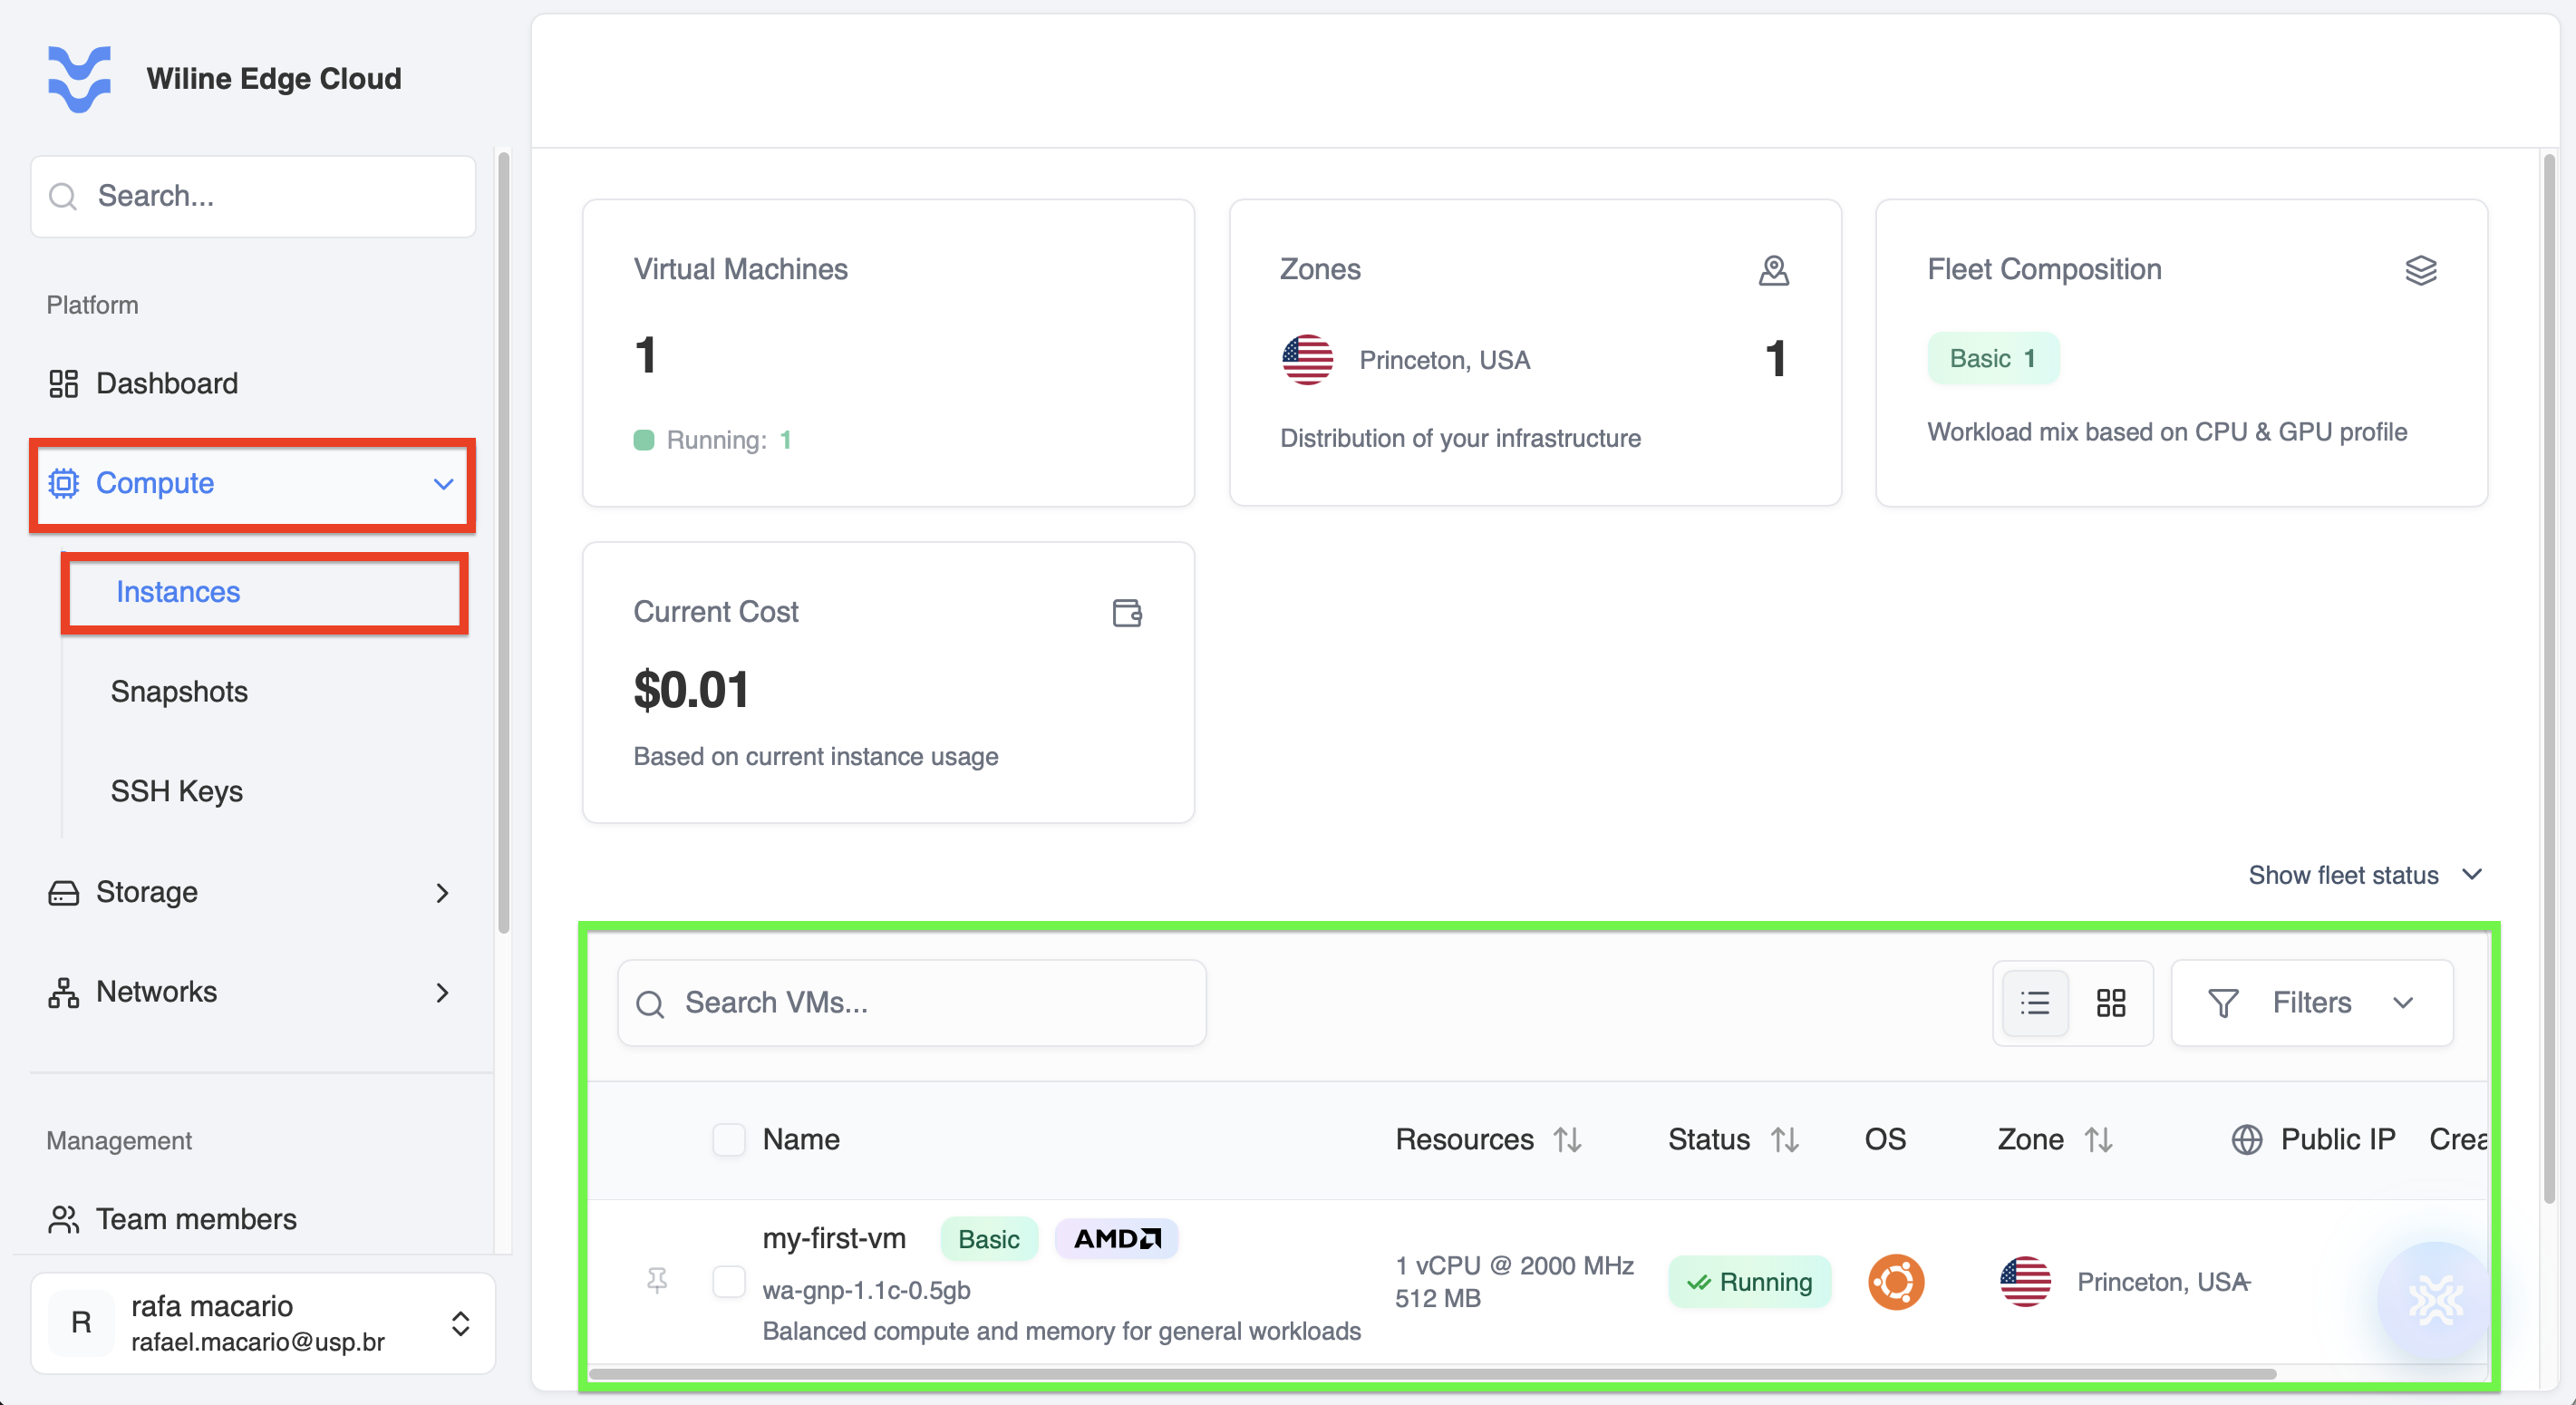 Figure 1 — VM dashboard with a list of VMs and their statuses.
Step 2: Manage a VM
Control Panel
When you click on a VM, the control panel appears at the top of the VM management page.
The control panel provides the following actions:
-
Refresh VM and Metrics Data: Updates the VM status and performance metrics.
-
Start VM: Starts the VM if it is stopped.
-
Stop VM: Stops the VM if it is running.
-
More Actions: Expands to show additional actions:
-
Restart VM: Reboots the VM.
-
Scale Server Resources: Adjust CPU and memory allocation.
-
Attach ISO: Mount an ISO for installation or recovery.
-
Attach NIC: Add a network interface.
-
Allocate Public IP: Assign a public IP for external access.
-
Open Console: Access the VM via browser console.
-
Delete VM: Permanently delete the VM.
-
Figure 2 — VM control panel with action icons.
If Your VM Has Stopped
If your VM is stopped, the status will be displayed as Stopped in the dashboard and control panel. Here’s what you can do:
Possible Reasons for VM Stopping
- Manual stop by the user.
- System failure or crash.
- Resource exhaustion (e.g., out of memory or disk space).
- Scheduled maintenance or updates.
Steps to Restart a Stopped VM
- Check VM Status: Ensure the VM status is Stopped in the dashboard.
- Start the VM: Click the Start VM button in the control panel.
- Verify VM Health: Go to the Metrics tab to monitor CPU, memory, and network usage.
- Troubleshoot if Needed: If the VM fails to start, check the Events tab for error details.
Step 3: VM Management Tabs
Once you open a VM’s management page, you can use these tabs to monitor, configure, and troubleshoot your instance.
Overview
Provides a quick high-level summary of the VM’s current state and configuration.
At the top, you’ll see real-time statistics:
- CPU Usage — e.g.
30% - Total Network I/O — e.g.
0 MB - Current Compute Charges — e.g.
$0.01
You can also find detailed information about your VM:
General Information
- Name:
my-first-vm - ID:
1902353c-4885-4a9f-a53b-ac6e9fbf75ae - OS:
Ubuntu 24.04 LTS - Service Offering:
wa-gnp-1.1c-0.5gb - Hypervisor:
KVM - Zone:
Princeton, USA
Network & Access
- Private IP:
10.80.4.37 - Network:
Default-Subnet - Username:
rafa.macario - SSH Key:
Rafael-macbook
Resource Allocation
- CPU:
1 vCPU @ 2000 MHz - Memory:
512 MB - Storage:
10 GB
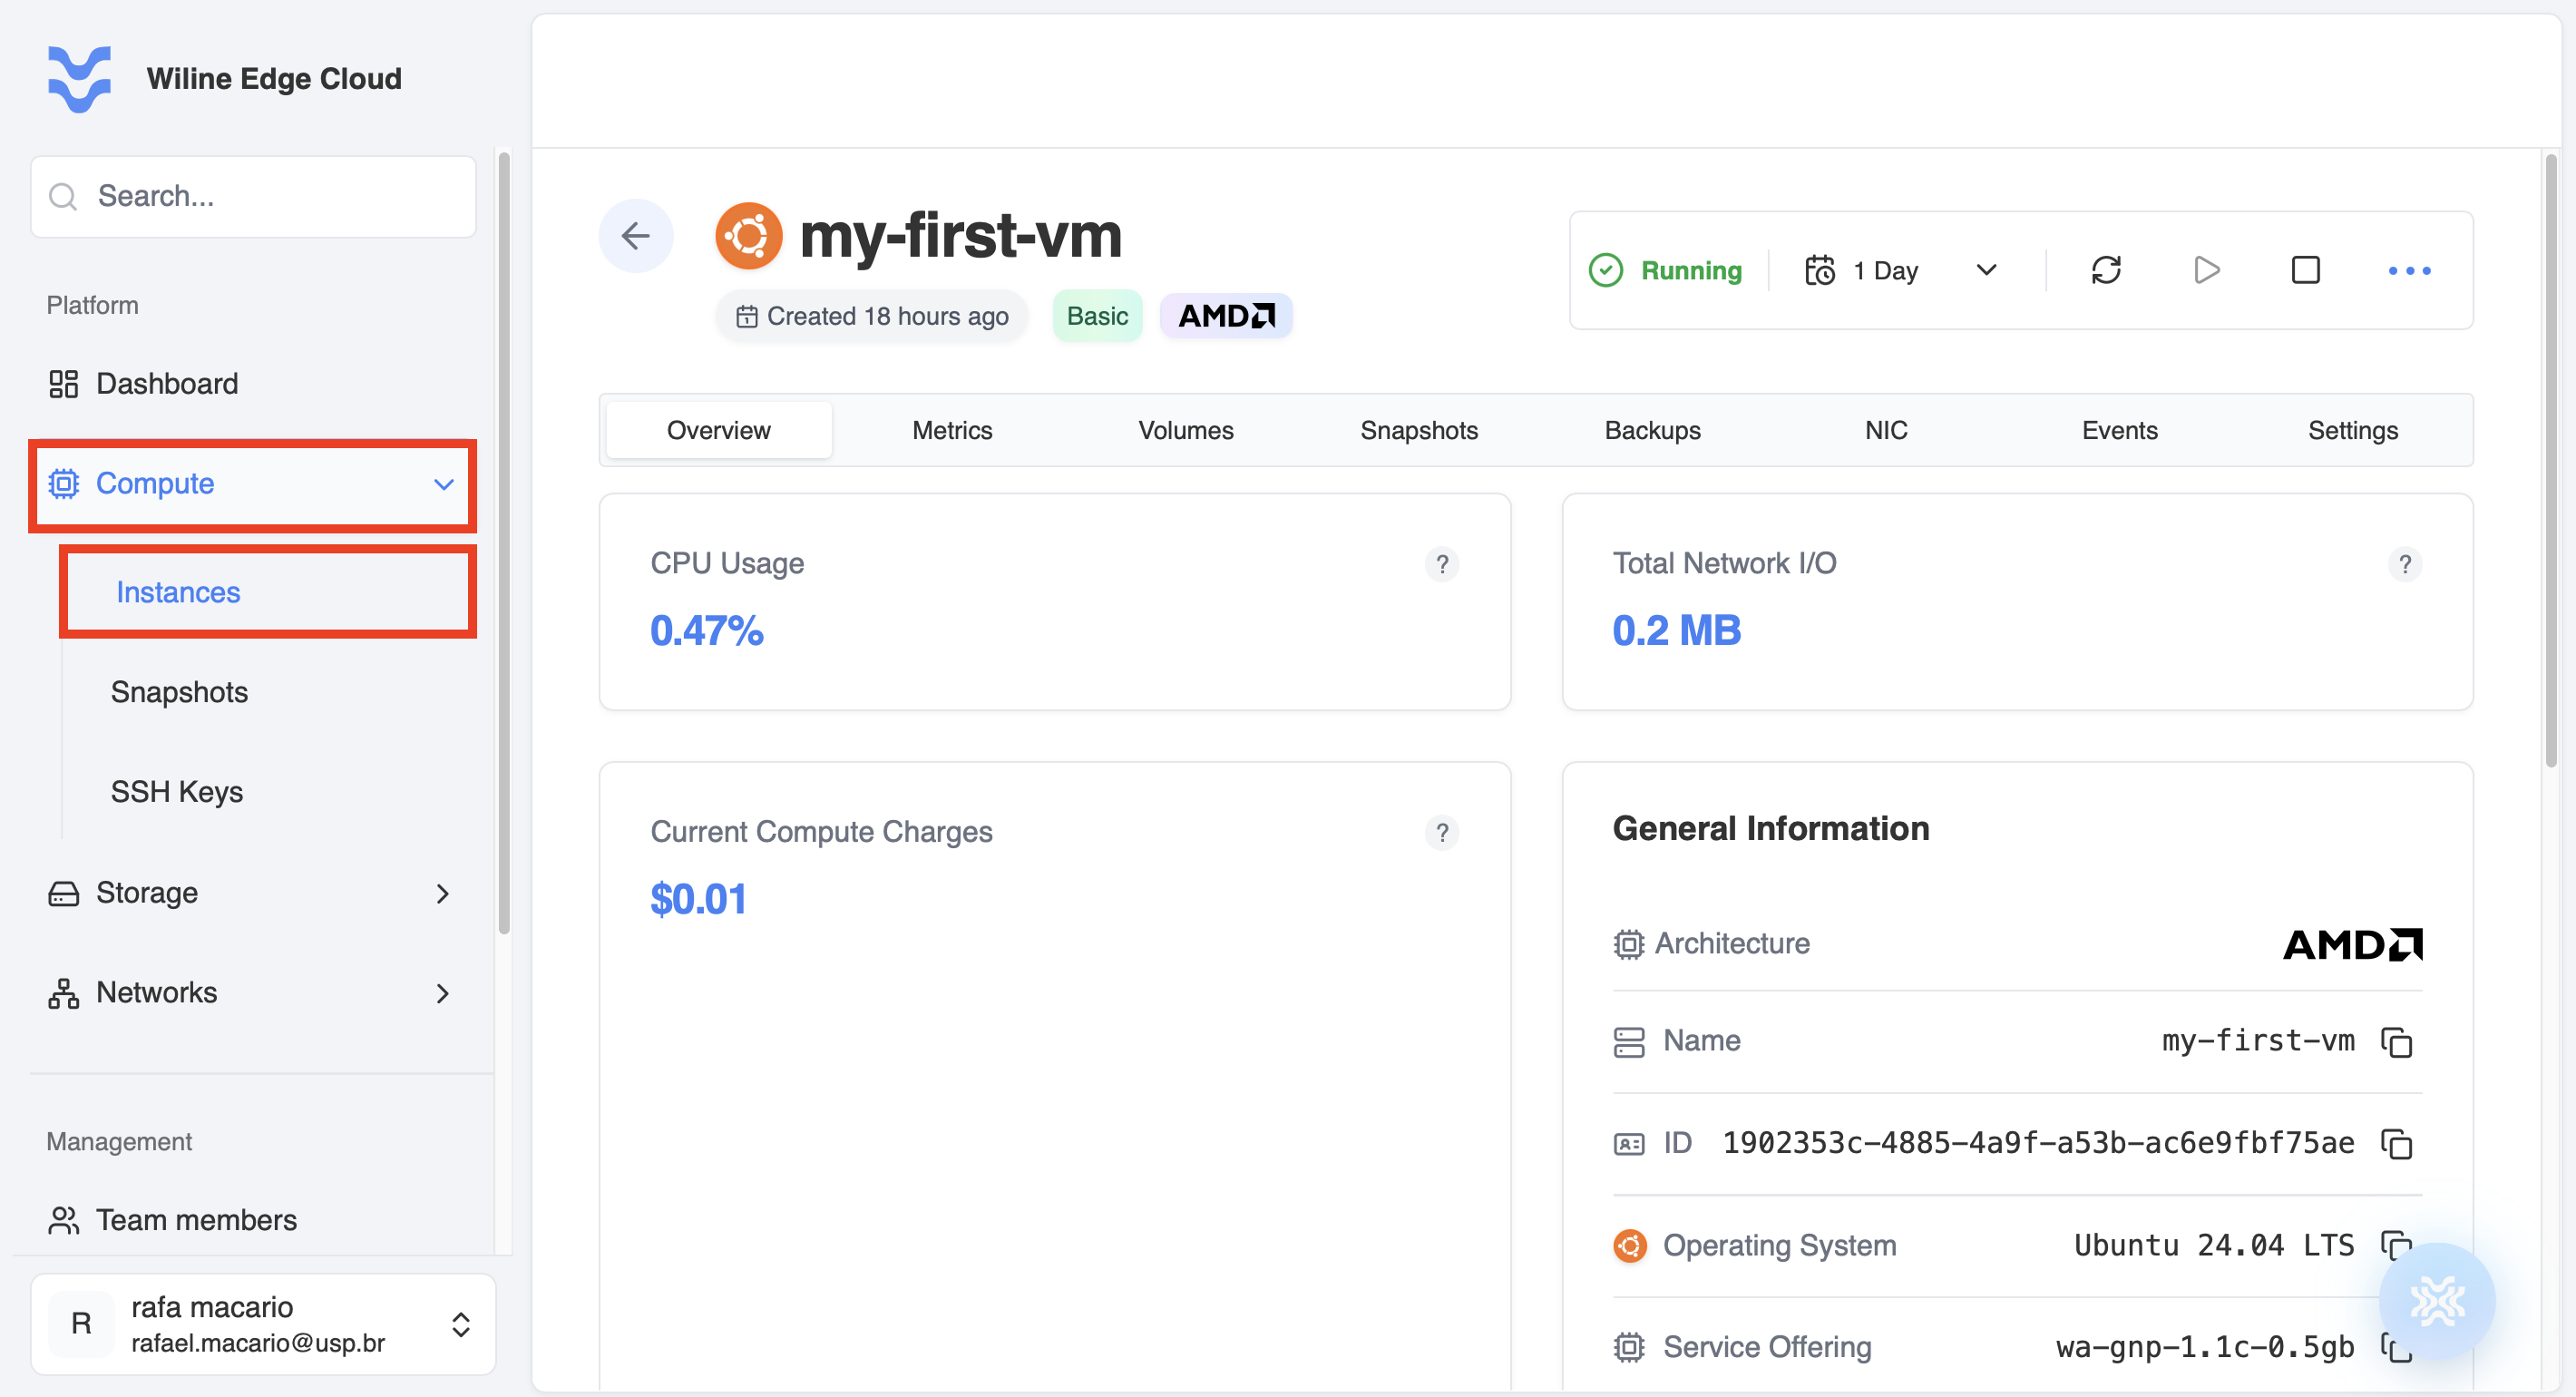 Figure 3 — VM Overview tab with general information.
Metrics
Use this tab to monitor real-time and historical performance of your VM.
Metrics are only available when the VM is running.
If the VM is stopped, graphs will show no activity.
You can also:
- Filter time ranges (e.g. last 1 hour, 1 day, 7 days)
- Customize charts using
- Change chart type (line, bar, area)
- Toggle stacked/combined view
- Show/hide grid, tooltip, legend
CPU & Memory Usage
Shows how much compute resources your VM is using over time.
Example:
- Avg CPU Usage:
1.7% - Peak CPU:
294.12% - Avg Memory Usage:
44.9% (230.1 MB) - Idle Time:
97.0%
What it means:
-
CPU Usage → how much processing power is being used
1.7%= very low usage294% peak= multiple cores being used during spikes
-
Memory Usage → RAM consumption
44.9%= about half of memory in use- Helps detect memory pressure
-
Idle Time → how much CPU is not being used
97% idle= VM is mostly inactive
Use this graph to:
- detect CPU spikes
- identify memory bottlenecks
- understand workload behavior
Network I/O
Shows incoming and outgoing network traffic.
Example:
- Avg Network Read:
0.2 KB/s - Avg Network Write:
0.1 KB/s - Peak Read:
24.0 KB/s - Peak Write:
15.0 KB/s - Total Network I/O:
0.2 MB
What it means:
- Read → data coming into the VM
- Write → data leaving the VM
- Total I/O → total transferred data
Interpretation:
- Very low values → VM is mostly idle
- Spikes → active traffic (API calls, downloads, etc.)
Use this graph to:
- monitor traffic patterns
- detect unusual spikes
- troubleshoot connectivity issues
Disk Performance
Shows disk read/write activity and I/O performance.
Example:
- Avg Disk Read:
1.66 MB/s - Avg Disk Write:
0.30 MB/s - Peak Read:
279.6 MB/s - Peak Write:
123.4 MB/s - Total Disk I/O:
1122.6 MB - Avg IOPS:
41 IOPS - Peak IOPS:
6199 IOPS
What it means:
- Read/Write (MB/s) → data throughput
- IOPS → number of disk operations per second
Interpretation:
- High MB/s → large file transfers
- High IOPS → many small operations (e.g. databases)
Use this graph to:
- identify disk bottlenecks
- analyze workload type (sequential vs random)
- monitor storage performance
Volumes
Shows all storage attached to the VM, along with usage, health, and billing.
At the top, you’ll see storage summary metrics:
- Total Storage:
10 GB - Volume Health:
100% (1 of 1 volumes ready) - Storage Billing:
$0.04
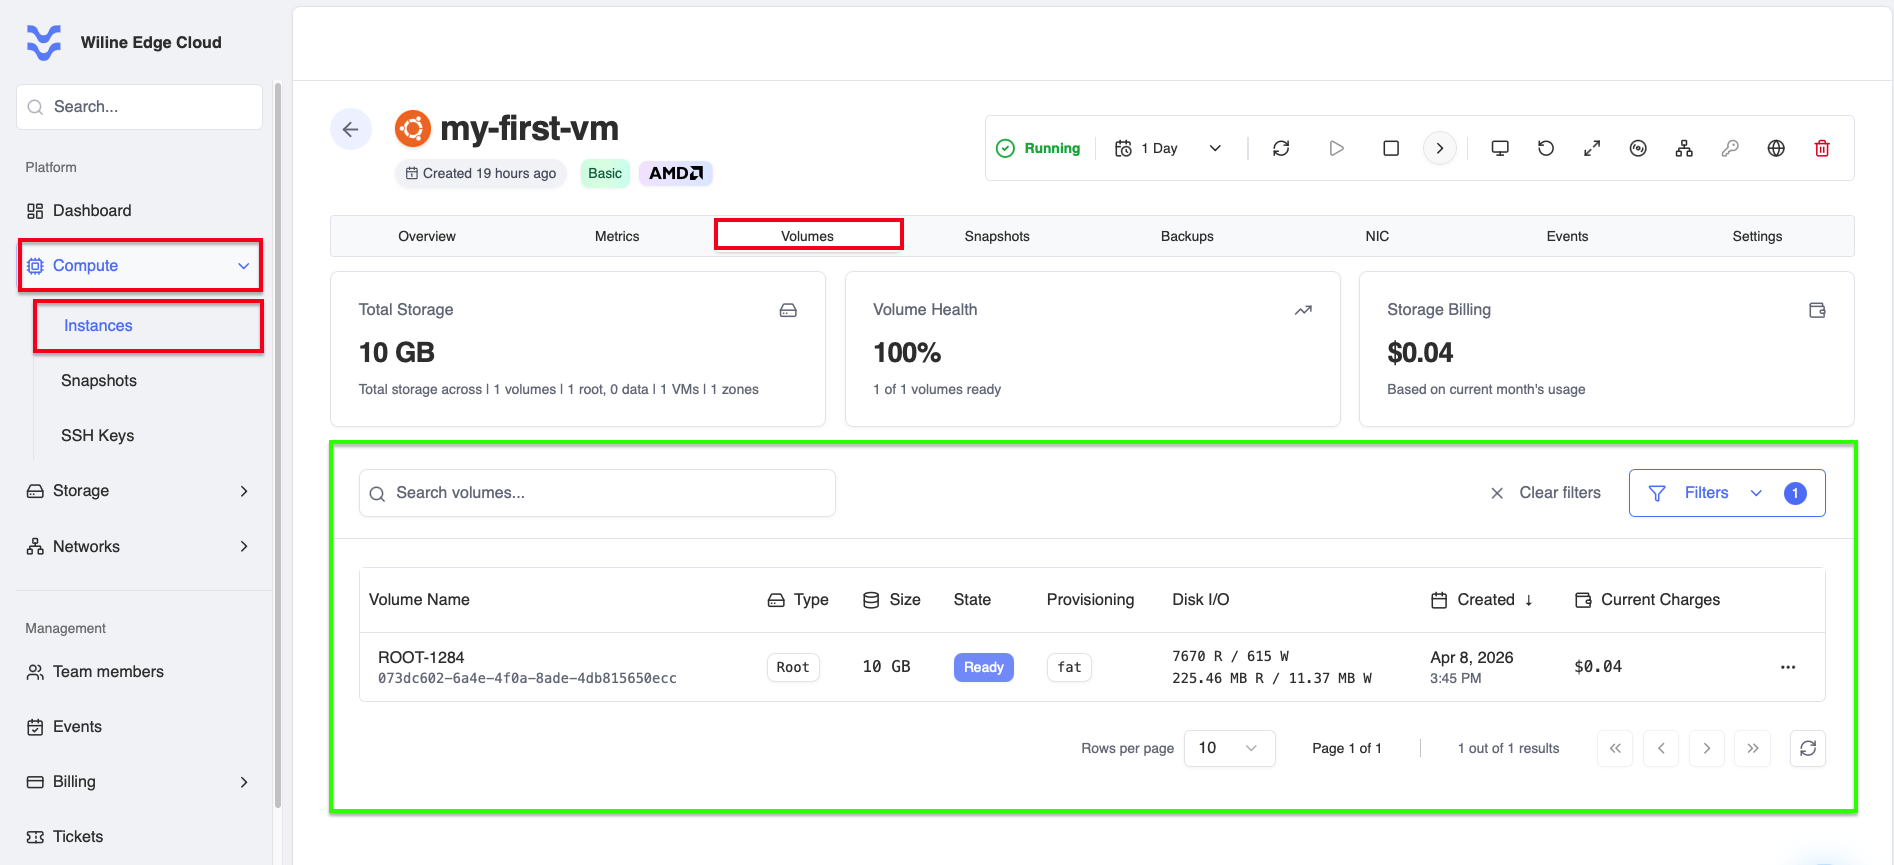 Figure 5 — Volumes tab with storage summary and attached volumes.
This gives you a quick view of:
- total allocated storage
- whether volumes are healthy
- current cost
Volume List
Below the summary, you’ll see a table with all attached volumes.
Example:
- Volume Name:
ROOT-1284 - ID:
073dc602-6a4e-4f0a-8ade-4db815650ecc - Type:
Root - Size:
10 GB - State:
Ready - Disk I/O:
8263 R / 1083 W(operations)294.32 MB R / 9.72 MB W(data transferred)
- Created:
Apr 8, 2026, 3:45 PM - Current Charges:
$0.04
:::tip What this means
-
Type (Root/Data)
Root= primary disk (OS installed)Data= additional storage volumes
-
State
Ready= volume is available and attached
-
Disk I/O
R / W= read/write operations- MB values = actual data transferred
:::
Snapshots
Create and manage point-in-time backups of your VM.
Snapshots capture the disk state so you can restore, clone, or recover your instance when needed.
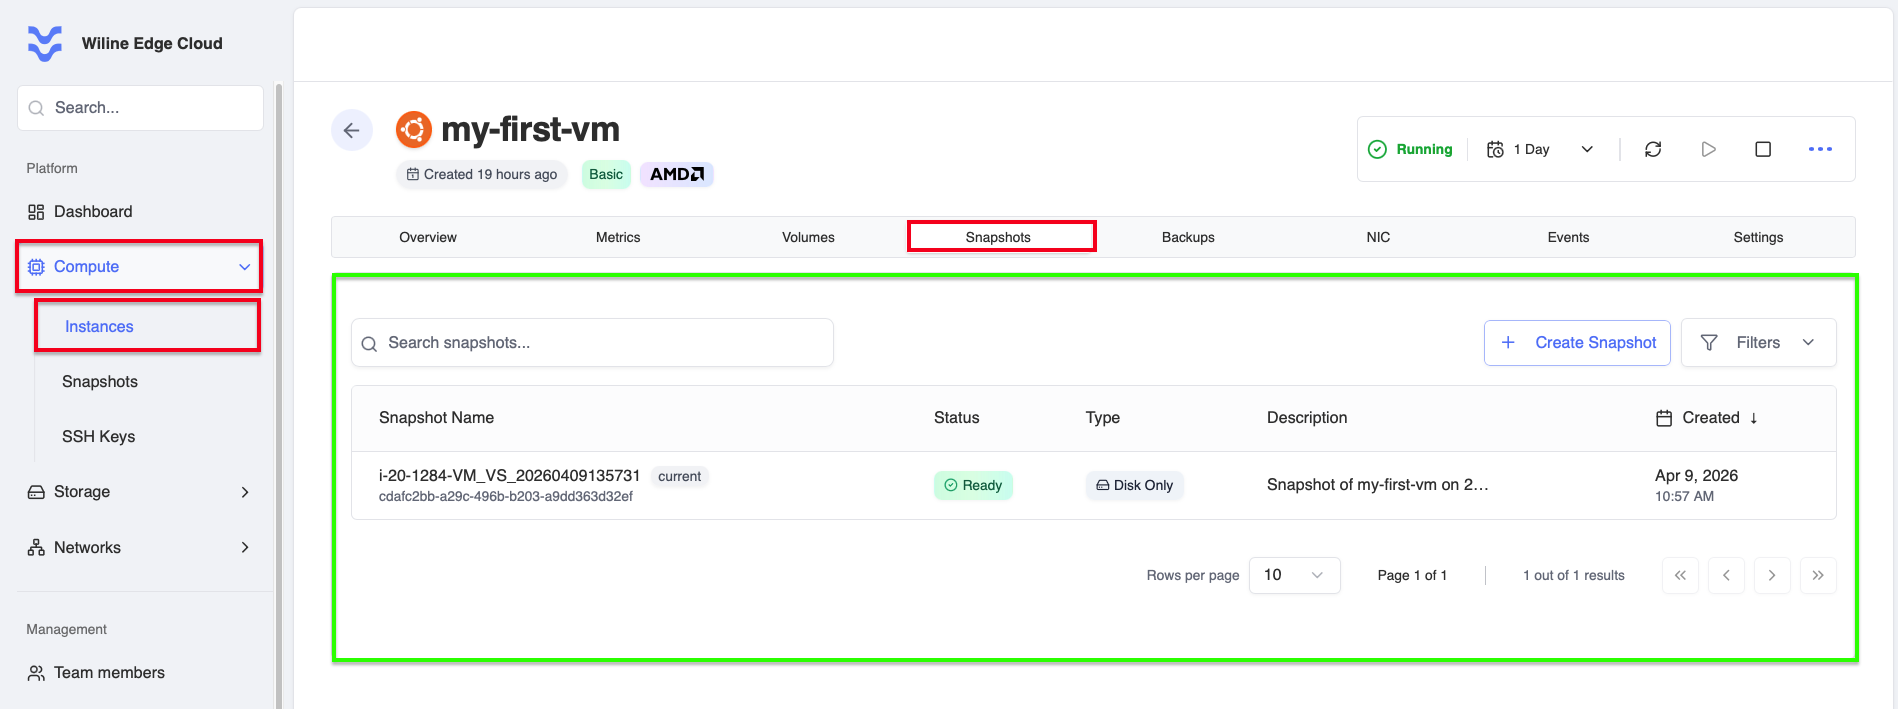 Figure 6 — VM Snapshots tab with snapshot list and management options.
Snapshot List
Below, you’ll see a table with all snapshots associated with the VM.
Example:
- Snapshot Name:
i-20-1284-VM_VS_20260409135731 - ID:
cdafc2bb-a29c-496b-b203-a9dd363d32ef - Status:
Ready - Type:
Disk Only - Description:
Snapshot of my-first-vm on 2026-04-09 - Created:
Apr 9, 2026, 10:57 AM
:::tip What this means
-
Status
Ready= snapshot is available for use- Other states may indicate creation or failure
-
Type
Disk Only= captures storage data only (no memory state)
-
Description
- Automatically generated or user-defined note describing the snapshot purpose
:::
What you can do here
- Create Snapshot — capture the current VM state before changes
- Restore — recover the VM or data from a snapshot
- Track backups — verify when snapshots were created
- Manage snapshots via the Actions menu
NIC (Network Interface Cards)
Manage the VM’s network connectivity across subnets, VPCs, and public IPs.
This section is divided into three tabs:
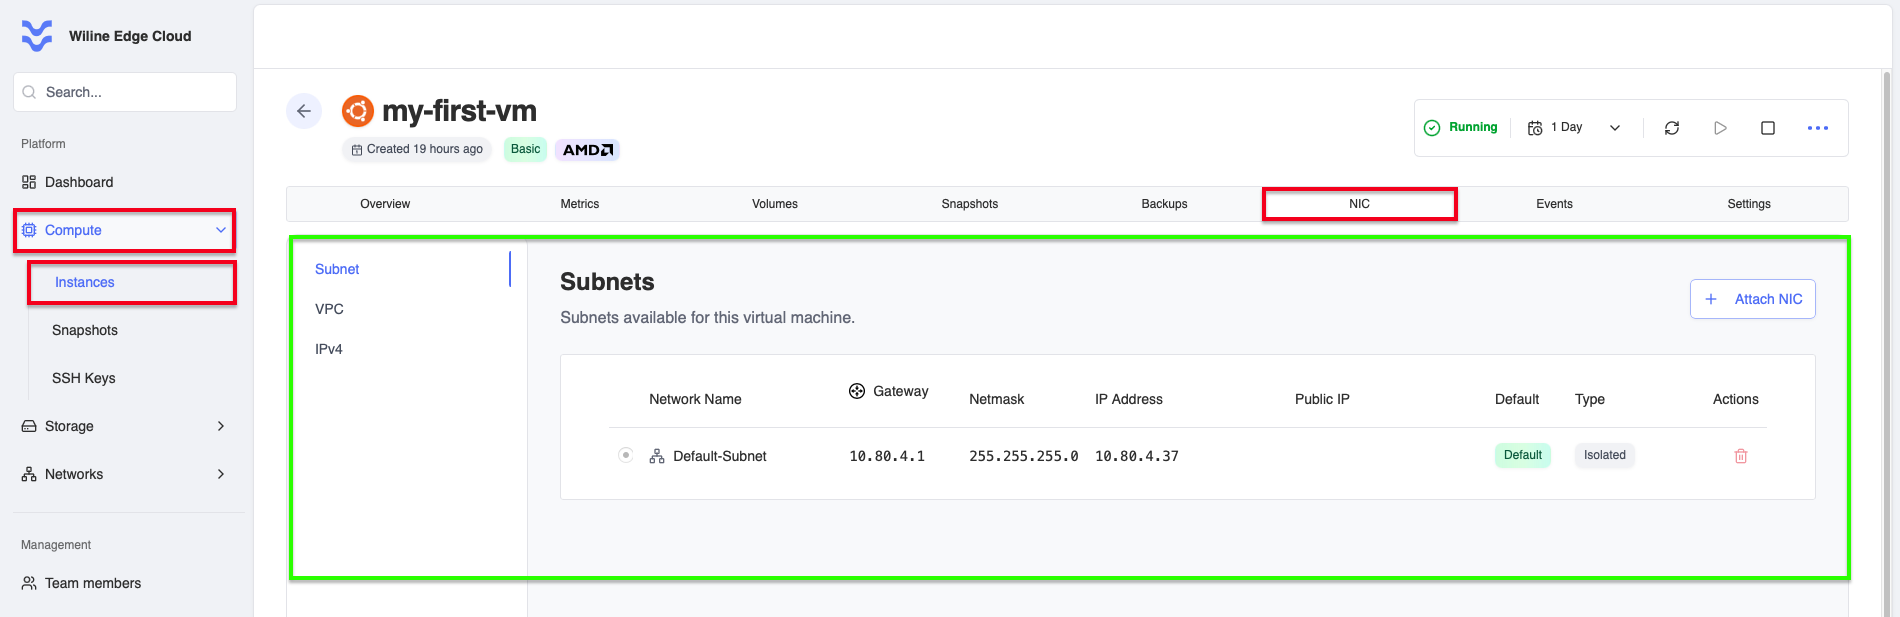 Figure 7 — NIC tab showing subnets, VPC, and public IP configuration.
Subnets
View and manage the network interfaces (NICs) attached to your VM.
Example:
- Network Name:
Default-Subnet - Gateway:
10.80.4.1 - Netmask:
255.255.255.0 - IP Address:
10.80.4.37 - Type:
Isolated
What you can do:
- Attach NIC — connect the VM to another subnet
- View network details — gateway, IP, and subnet configuration
- Remove NIC via the Actions menu
VPC
Shows the Virtual Private Cloud (VPC) where the VM is deployed.
Example:
- Name:
Default VPC - ID:
a6bca62b-3414-4bf6-9fcb-8cfe5a074885 - Status:
Enabled - CIDR:
10.80.4.0/24 - Public IP Range:
10.80.4.0 – 10.80.4.255 - Subnets:
1 - Zone:
Princeton, USA
What you can do:
- View Details — open full VPC configuration
- Delete VPC — remove the VPC (if no dependencies)
- Access additional actions via the Actions menu
Public IPs (IPv4)
Displays all public IP addresses assigned to the VM.
If no IP is assigned, you will see:
No Public IPs Assigned
This means:
- The VM is not accessible from the internet
- Only private/internal network access is available
What you can do:
- Go to Elastic IPs to create a new public IP
- Assign the IP to this VM
- Manage existing public IPs from that section
Example scenario:
- A VM without a public IP (
10.80.4.37) is only reachable inside the VPC - After assigning a public IP, it becomes externally accessible
Events
Track all actions and system activity related to the VM.
This tab provides a chronological log of operations, including user actions and system processes.
What you can do here:
- Track activity — see who performed actions and when
- Troubleshoot issues — identify failed or repeated operations
- Audit changes — review VM lifecycle events (start, stop, snapshots)
Example events:
Vm Start→ VM was successfully startedVm Stop→ VM was stoppedVmsnapshot Create→ snapshot createdVmsnapshot Delete→ snapshot removed
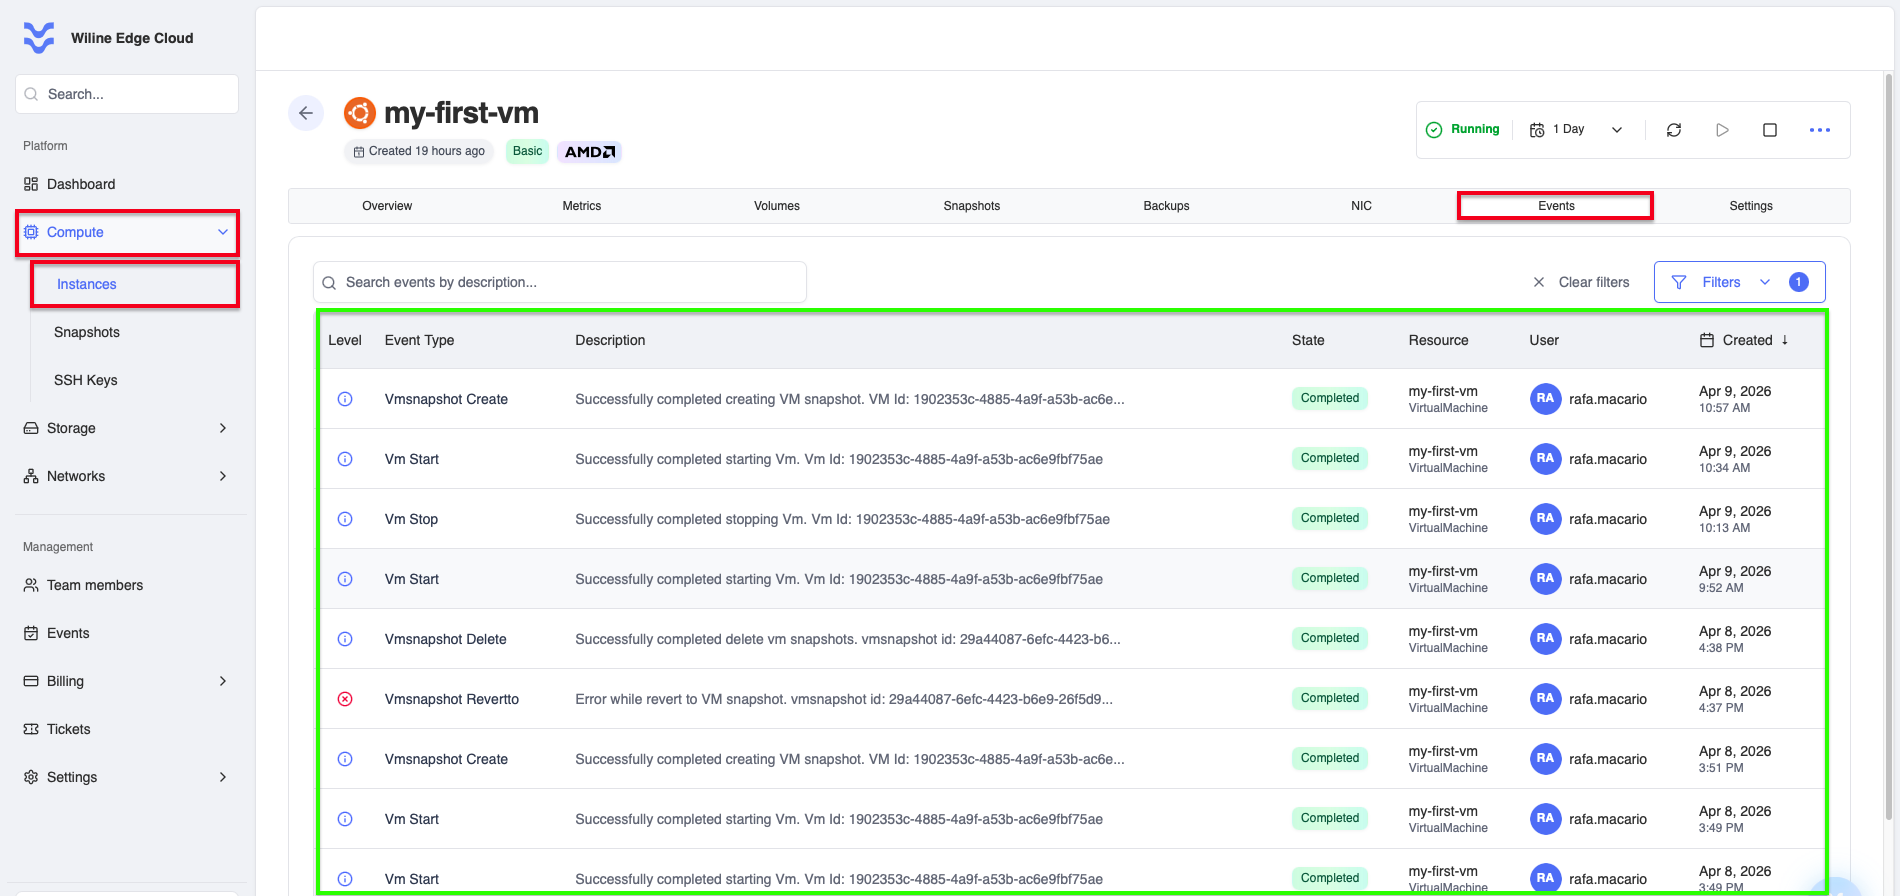 Figure 8 — VM Events tab with event logs.
Example entry
- Event Type:
Vm Start - Description:
Successfully completed starting Vm. Vm Id: 1902353c-4885-4a9f-a53b-ac6e9fbf75ae - State:
Completed - Resource:
my-first-vm - User:
rafa.macario - Created:
Apr 9, 2026, 12:49 PM
Filters
Use filters at the top to refine results:
- Event Type — e.g.
Vm Start,Vmsnapshot Create - State — e.g.
Completed,Failed - User — track actions by specific users
Settings
Configure metadata and organization for your VM.
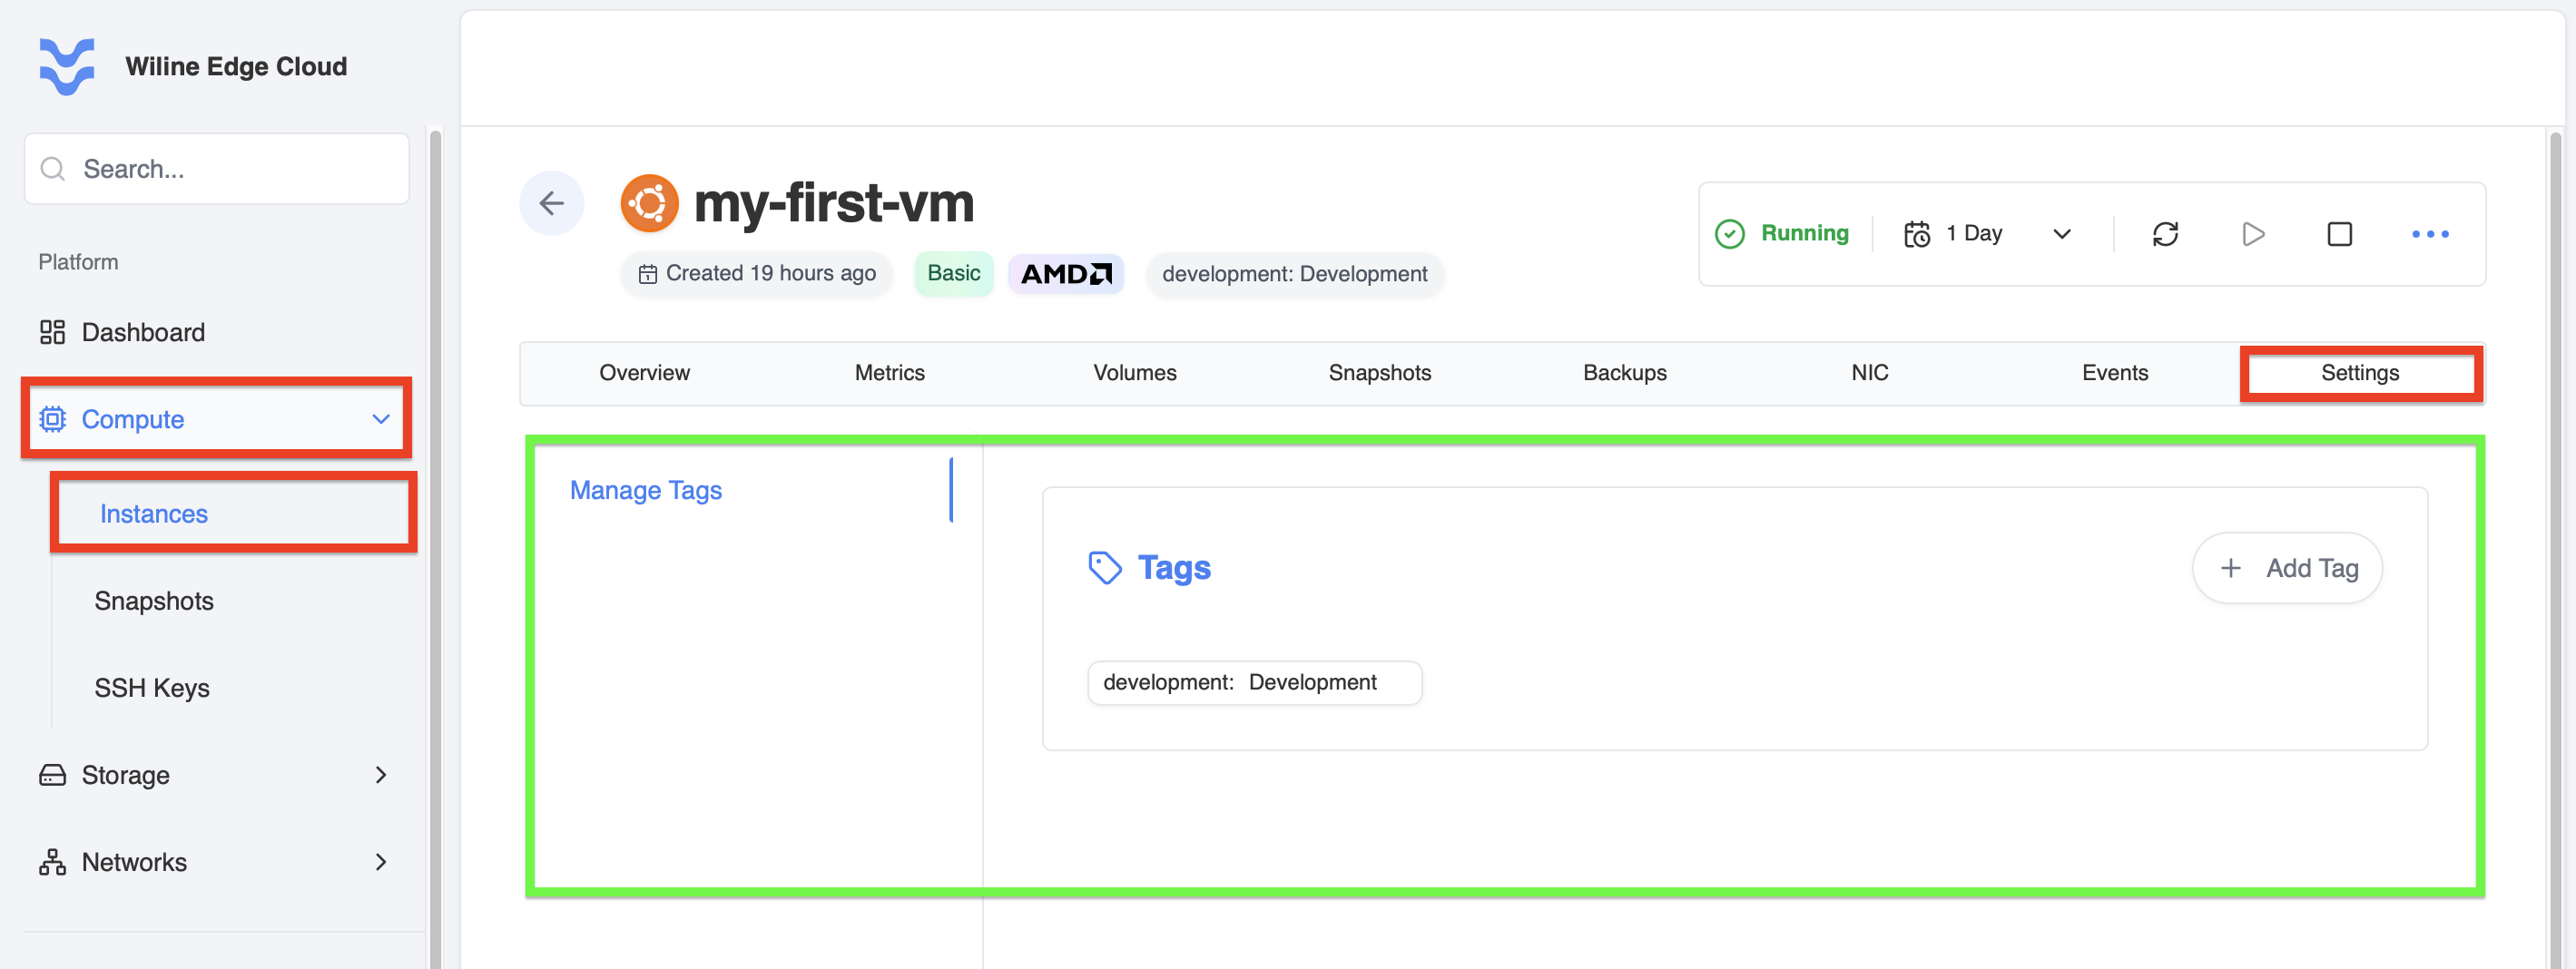 Figure 9 — VM Settings tab with tag management.
Manage Tags
Tags help you organize, filter, and manage your VMs.
Tags are useful for:
- grouping resources (e.g.
project=cloud-docs) - filtering in dashboards
- cost tracking and organization
Example:
- Key:
development - Value:
Development
What you can do:
- Add Tag — create new key-value pairs (e.g.
env=prod,team=backend) - Edit Tag — update existing values
- Remove Tag — delete tags that are no longer needed
Best Practices
- Monitor VM metrics regularly to ensure optimal performance.
- Create snapshots before making significant changes to your VM.
- Use tags to organize and manage your VMs efficiently.
- Enable delete protection to prevent accidental VM deletion.
- Troubleshoot stopped VMs by checking the Events tab and resource availability.
- Customize graphs in the Metrics tab to focus on relevant performance data.