Manage Events
The Events section provides a centralized and structured view of all system activities within WiLine Edge Cloud (WEC).
From this page, you can:
- Analyze event statistics and trends
- Monitor successful and failed operations
- Search and filter events across your infrastructure
- Audit user and system actions
Access the Events Page
After logging in to the WiLine Edge Cloud:
- Navigate to Management → Events
When you open the Events page, the layout is divided into two main sections:
- Dashboard (top) — high-level metrics and charts
- Events Table (bottom) — detailed list of all events
The dashboard is shown first, giving you a quick overview of activity.
Only after that, you can scroll down to access the full events table, where detailed analysis and filtering take place.
Understand the Dashboard
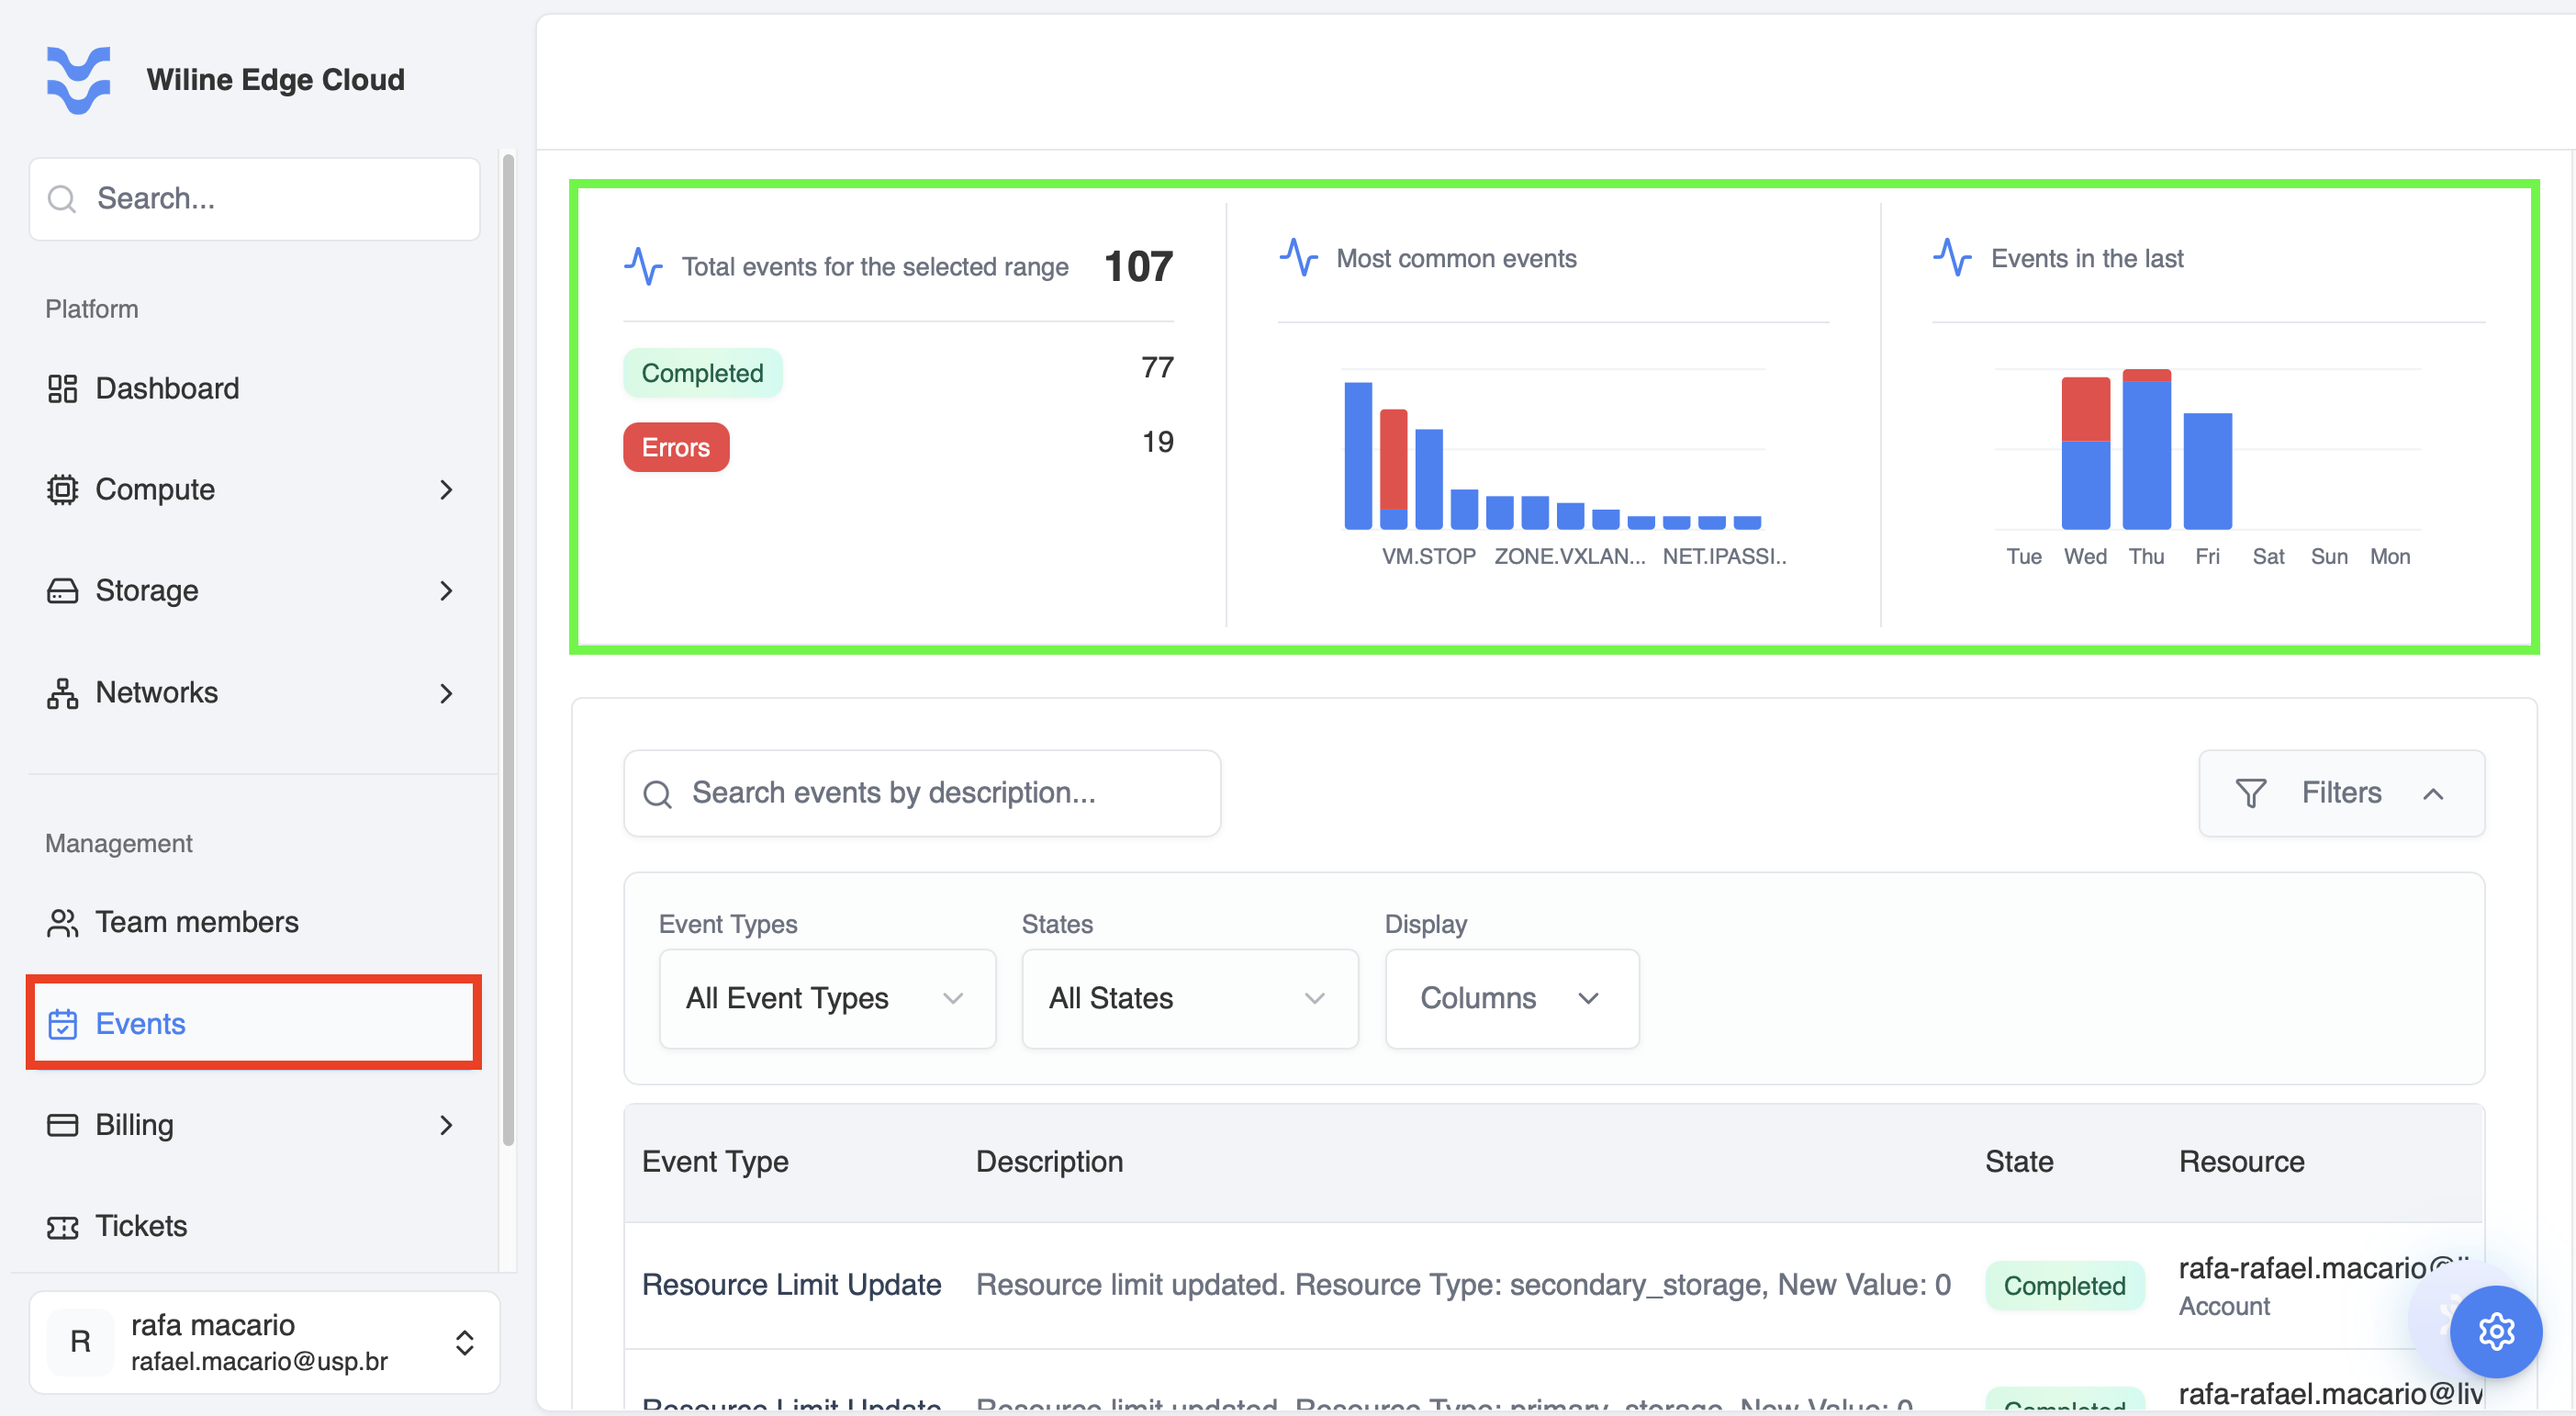
Figure 1: Events dashboard with summary metrics and charts.
The top section of the page is the Events Dashboard. It provides a high-level view of system activity through aggregated metrics and charts for the selected time range.
This section is separate from the events table below and focuses on aggregated metrics and visual insights.
Total Events for the Selected Range
Displays the total number of events recorded in the selected time window.
Example:
- Total Events:
107
This includes all events, regardless of their state.
Completed vs Errors
Shows a summary of event outcomes:
- Completed — successfully executed operations
- Errors — failed or problematic operations
Example:
- Completed:
77 - Errors:
19
This metric helps you quickly assess system health and reliability.
Most Common Events (Bar Chart)
Displays the most frequent event types in the selected time range as a bar chart.
Each bar corresponds to an event type, and its height represents how many times that event occurred.
This allows you to quickly see which operations are happening most often in your environment.
Example
If the chart shows:
RESOURCE_LIMIT.UPDATE— 25 eventsSNAPSHOT.CREATE— 18 eventsVM.START— 12 eventsVM.STOP— 10 events
This means:
- Resource limits are being updated frequently
- Snapshots are created often (e.g., backups or automation)
- Virtual machines are actively being started and stopped
Use this chart to:
- Identify high-frequency operations
- Detect unusual spikes in specific event types
- Understand overall system usage patterns
Events Over Time (Bar Chart)
Displays event activity across recent days (e.g., Tue → Mon), using a bar chart.
Each day includes:
- Completed events
- Error events
Example:
- Tuesday: 12 completed / 2 errors
- Wednesday: 18 completed / 3 errors
- Thursday: 9 completed / 1 error
This helps you:
- Detect spikes in activity
- Identify days with higher failure rates
- Correlate issues with deployments or usage patterns
Event Details Table
Below the dashboard, you will find the Events Table, which provides a detailed, row-level view of all events.
The Events Table is the primary interface for searching, filtering, and investigating events.
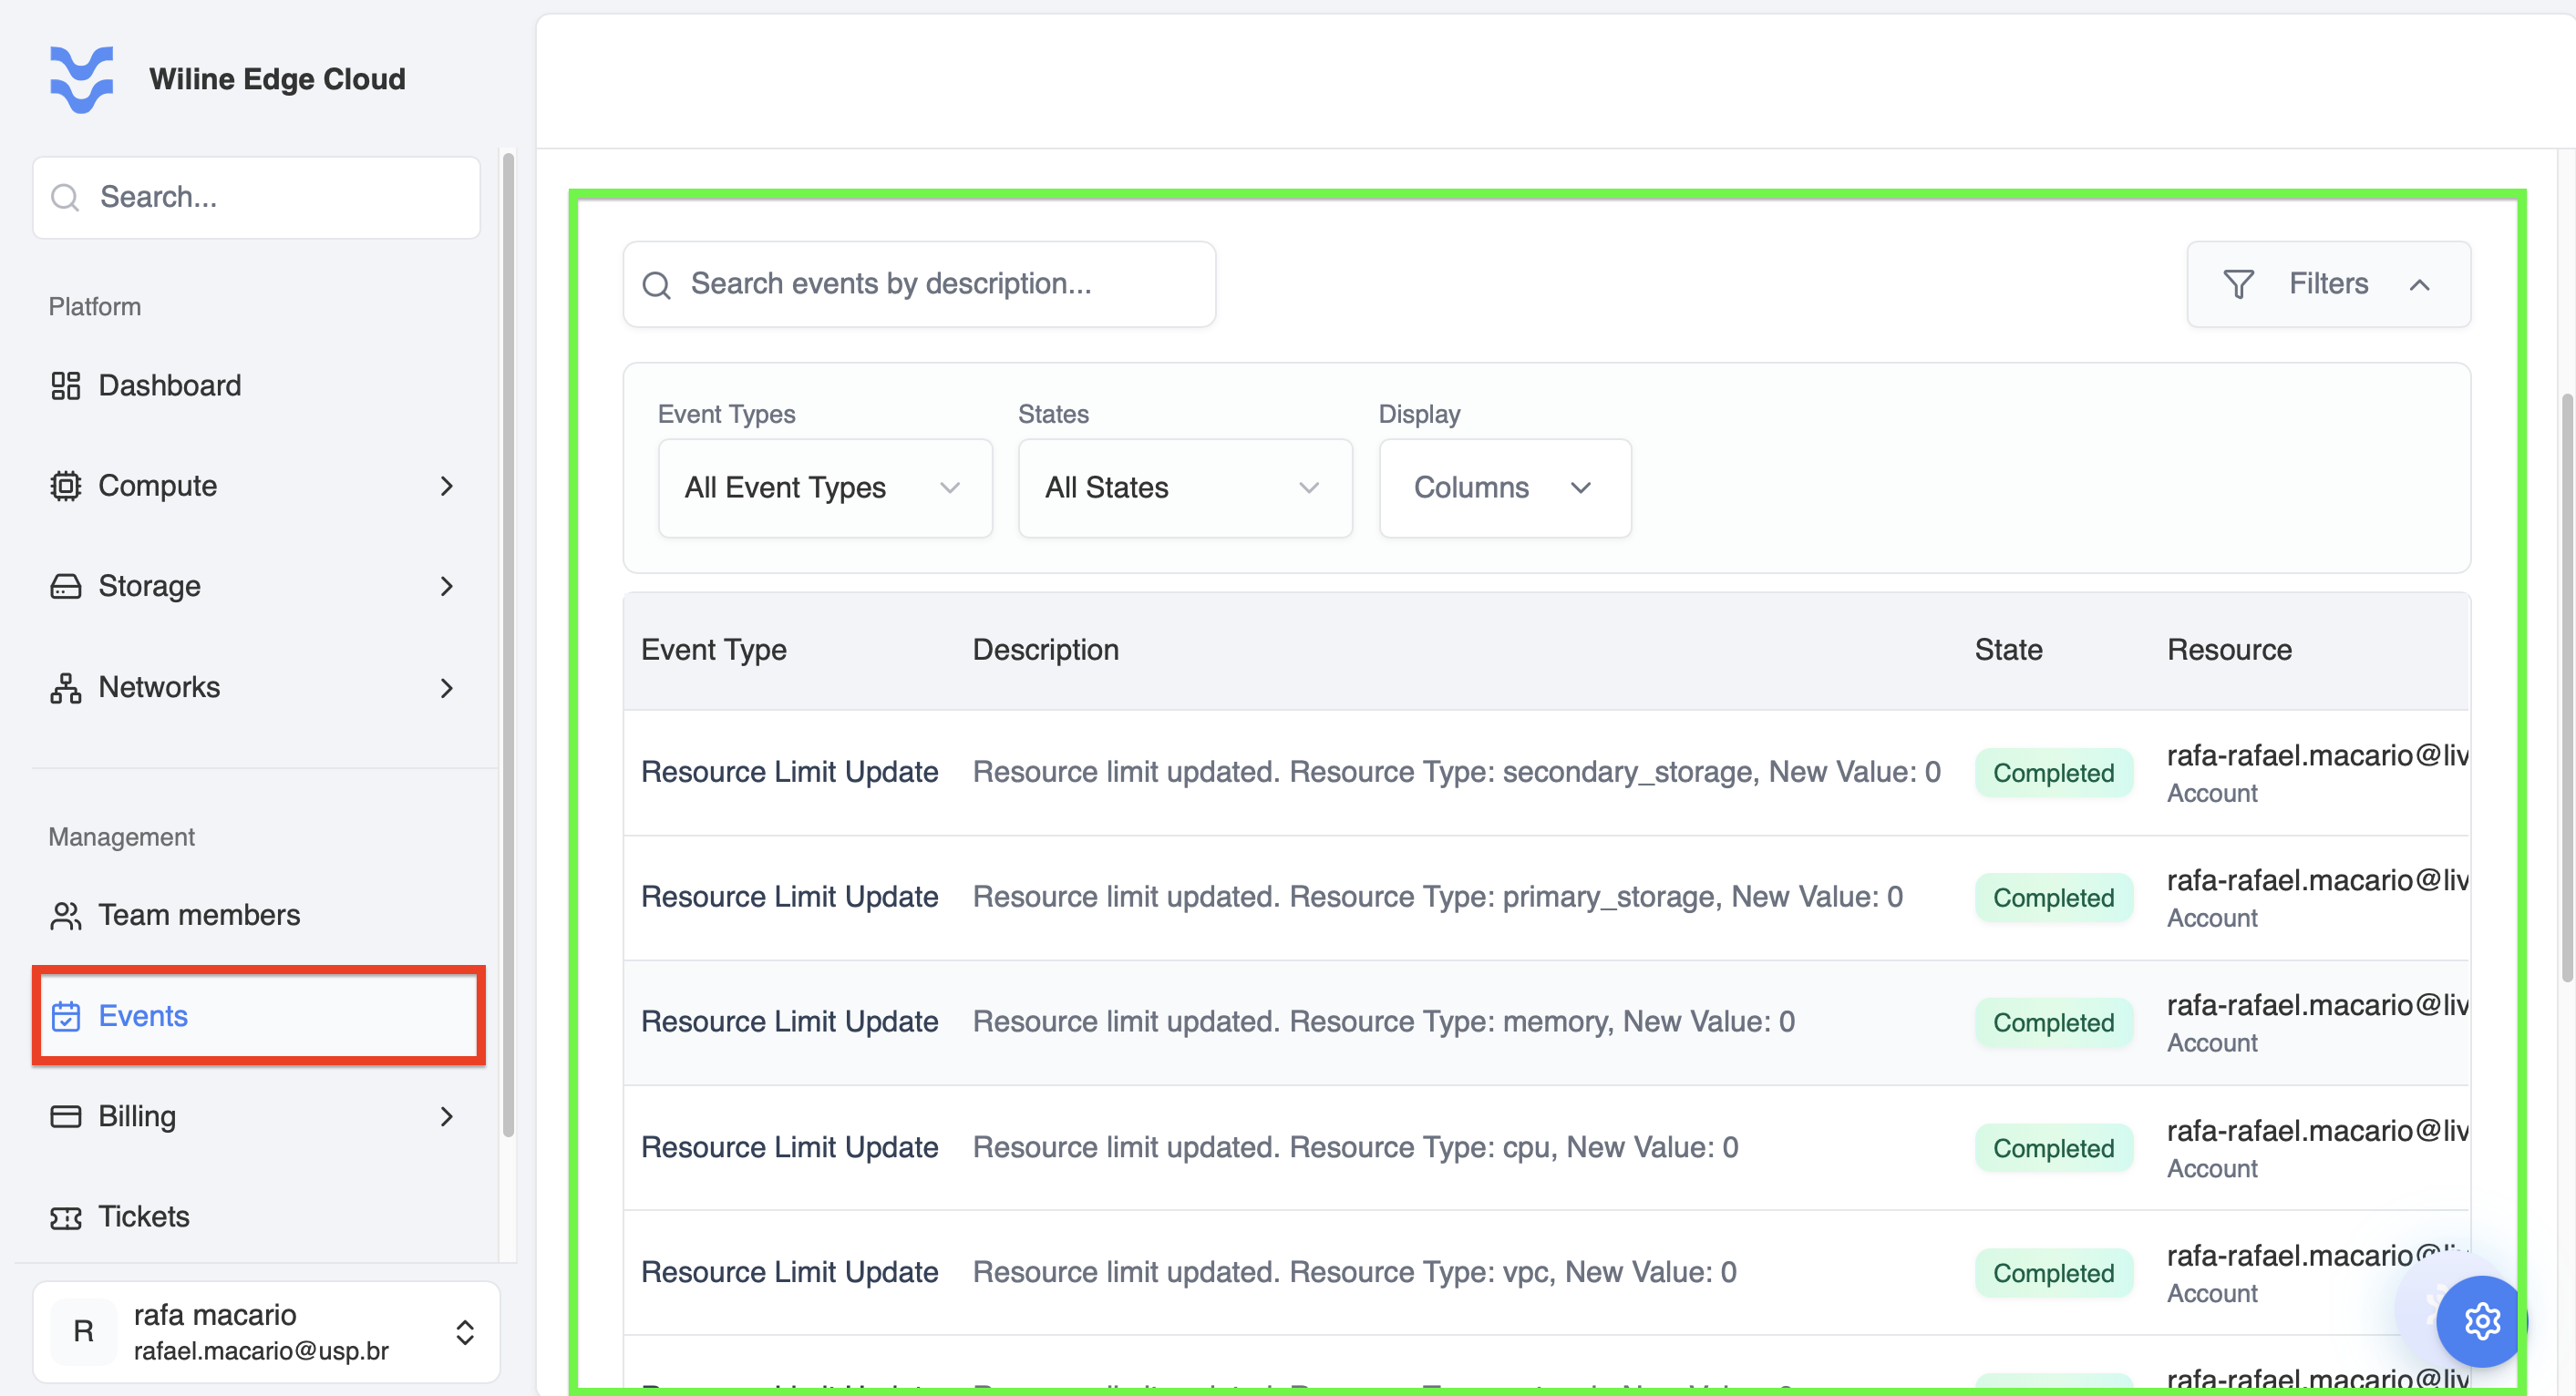
Figure 2: Events table with search, filters, and full event listing.
Filter Events
Above the table, you can refine results using filters and search.
Event Types
Filter events by operation type.
Available options include:
All Event TypesACCOUNT.CREATEBUCKET.CREATECREATE_TAGSFIREWALL.OPENFIREWALL.CLOSENETWORK.CREATENETWORK_ACL.UPDATEREGISTER.CREATEREGISTER_SSH_KEYPAIRREGISTER_USER_KEY
Example Use Case
To analyze infrastructure provisioning:
- Select
NETWORK.CREATEandBUCKET.CREATE
→ View only resource creation events
States
Filter events by execution status:
All StatesCreatedScheduledStartedCompletedCanceledError
Example Use Case
To investigate failures:
- Select
Error
→ View only failed operations
Display (Columns)
Customize which columns are visible in the table:
- Event Type
- Description
- State
- Resource Name
- User
- Created
Example Use Case
To focus on auditing:
- Show only Event Type, User, and Created
Search
Use the search bar to locate events by:
- Description text
- Resource name
- Keywords
Example
Search for: cpu
→ Returns events such as:
Resource limit updated. Resource Type: cpu
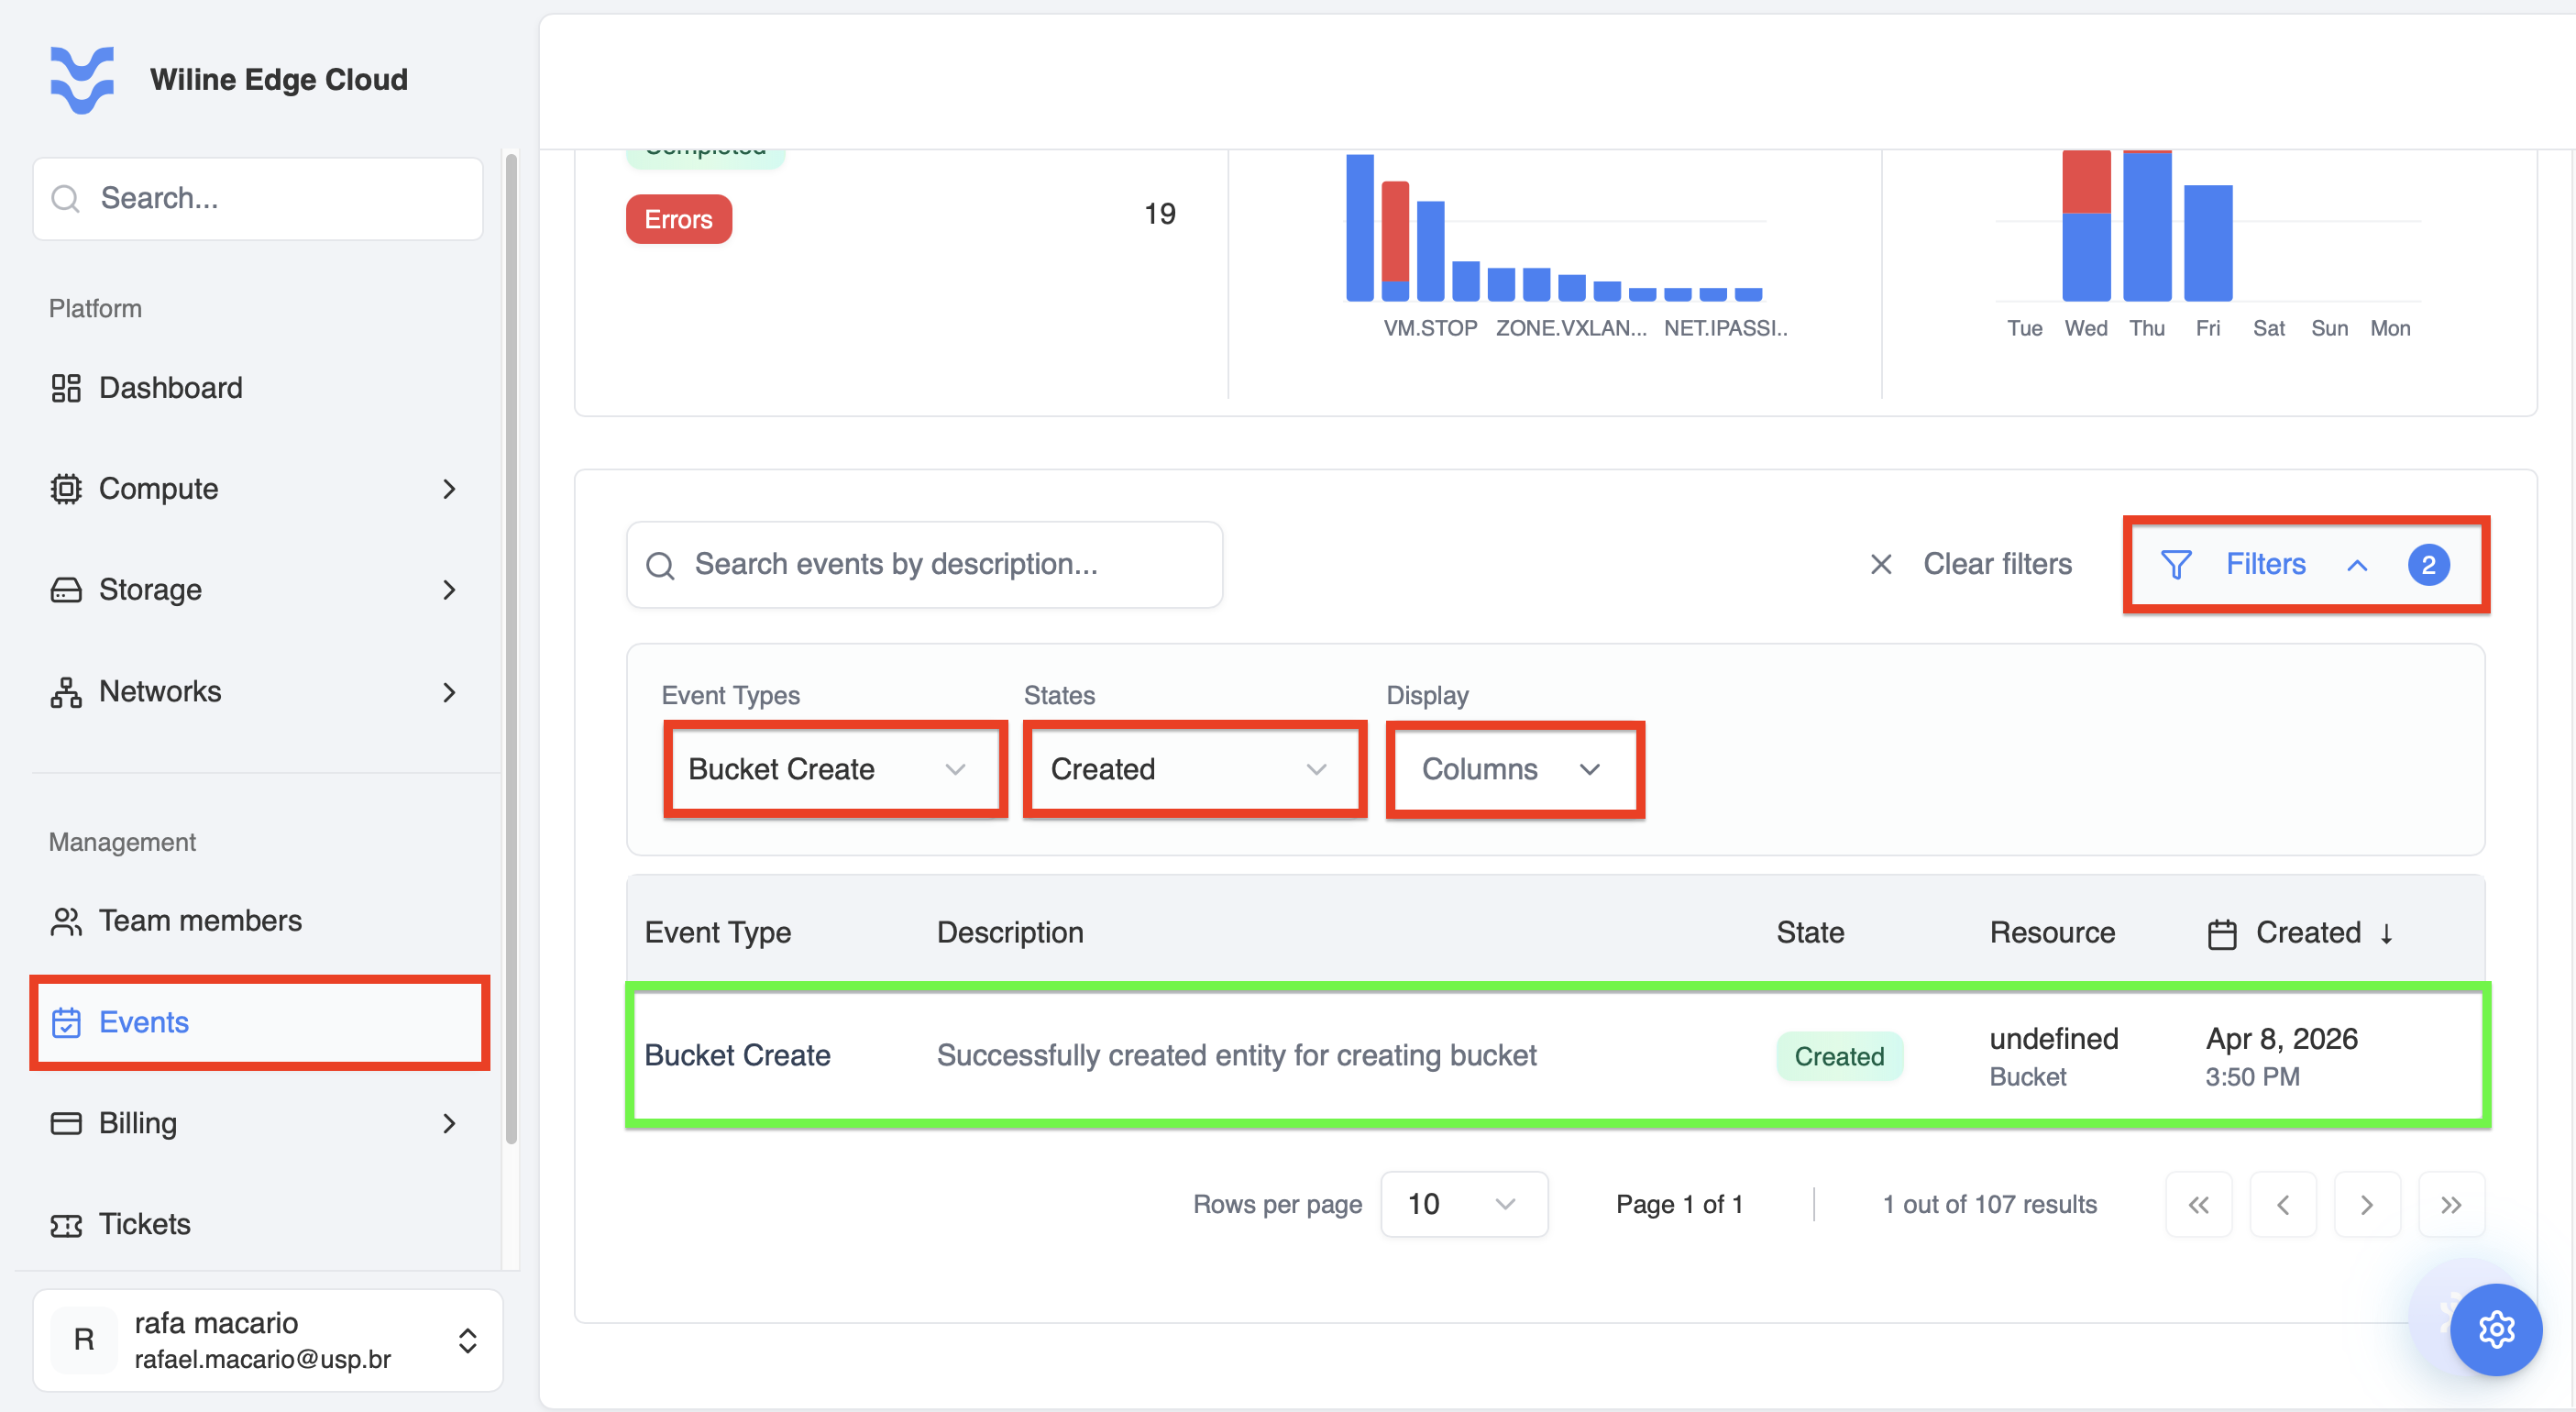
Figure 3: Events table filtered by event type and state.
In this example, the table is filtered by:
- Event Type:
BUCKET.CREATE - State:
Created
Additionally, in Display (Columns), the User column has been removed.
As a result, the table shows only events matching both filters. In this case, a single event is returned, making it easier to focus on a specific operation.
Table Columns
Table Columns Explained
- Event Type — operation performed
- Description — detailed explanation of the action
- State — current status
- Resource — affected entity (e.g., Account, VM, Network)
- User — who triggered the event
- Created — timestamp of the event
:::note Example: Event Entry
- Event Type:
Resource Limit Update - Description:
Resource limit updated. Resource Type: memory, New Value: 0 - State:
Completed - Resource:
Account - User:
rafa.macario - Created:
Apr 10, 2026, 6:36 PM
:::
Pagination
Navigate through results using controls at the bottom of the table:
- Go to first or last page
- Move to previous or next page
- View total results (e.g.,
107 out of 107)
Key Benefits
The Events section enables you to:
- Maintain full visibility into platform activity
- Perform auditing and compliance checks
- Detect and troubleshoot errors quickly
- Understand usage trends and behavior
- Monitor user and system operations at scale
Next Steps
- Monitor error trends regularly
- Use filters to isolate issues
- Analyze frequent events to optimize workflows
- Use event logs for auditing and reporting