Navigate the dashboard
The Dashboard is your day-to-day snapshot of the environment — what you're spending, how much of each resource limit you're using, the health of your instances, and what's driving cost.
Open the dashboard
After logging in to the WiLine Edge Cloud, the Dashboard is your landing page. You can return to it any time via Home → Dashboard in the left sidebar.
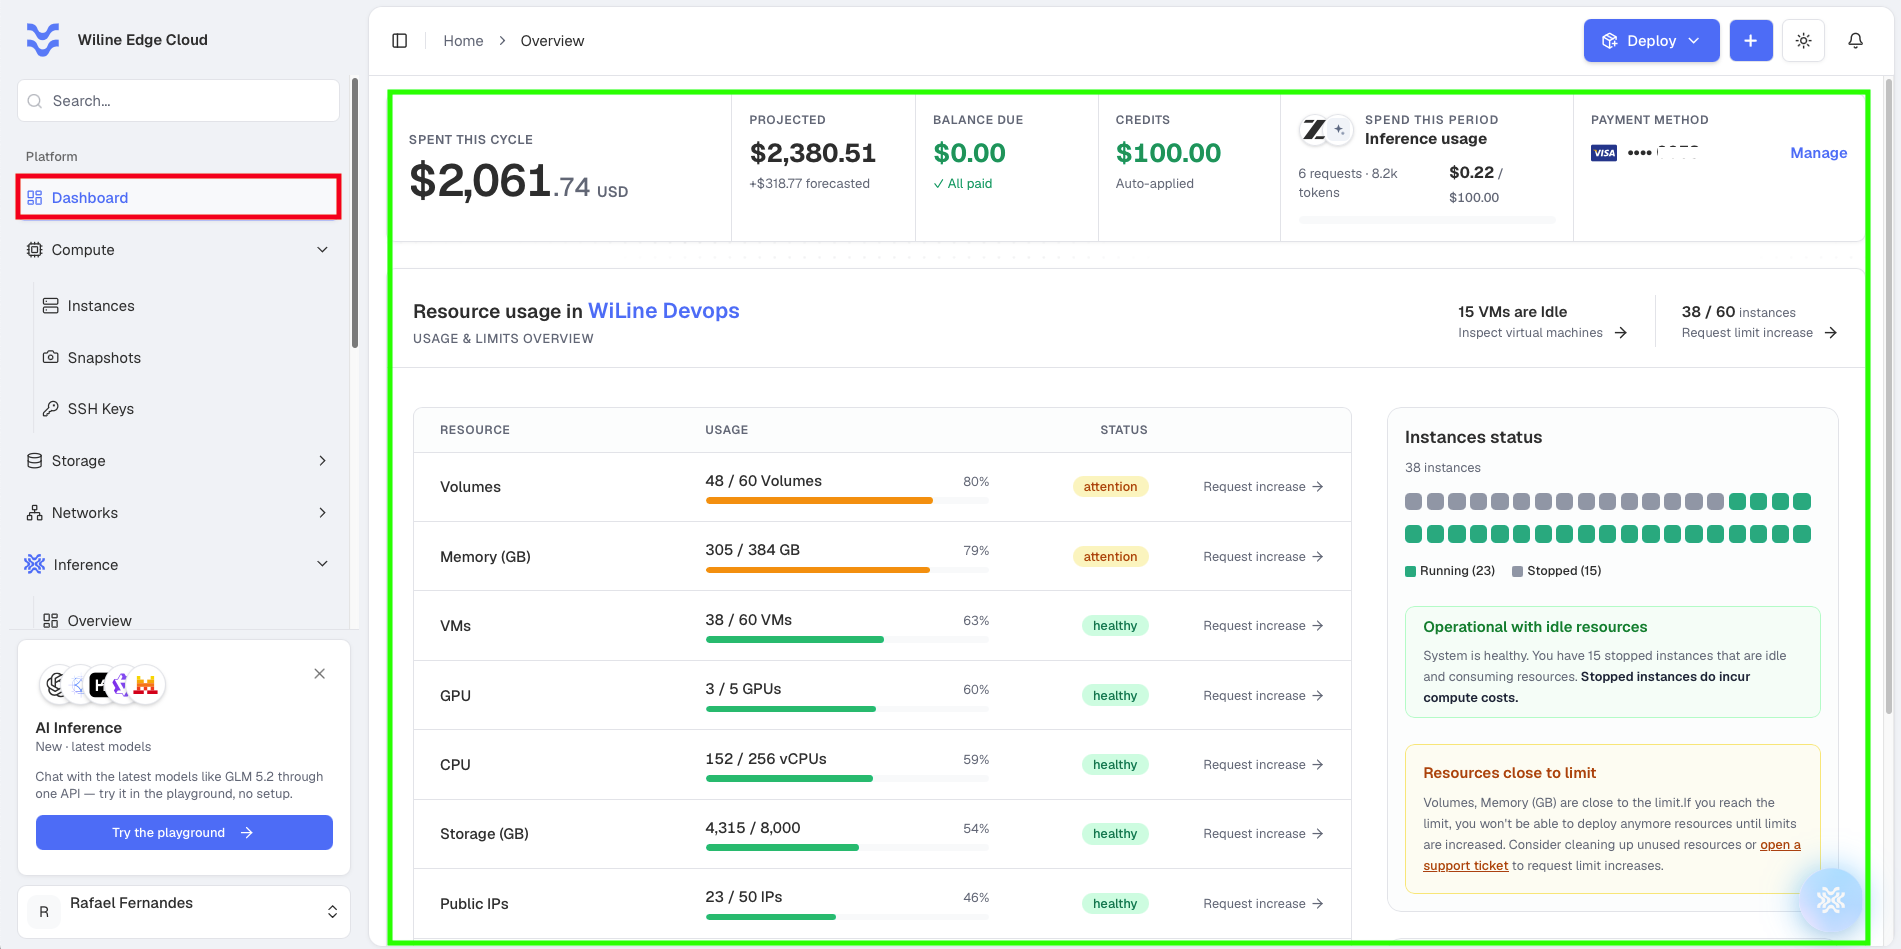
Figure 1. The dashboard Overview — cost summary, resource usage, instance status, and top spenders.
Account & cost summary
A row of cards across the top summarizes your spend and account status:
- Spent this cycle — charges accrued so far in the current billing cycle (in Figure 1, $2,061.74).
- Projected — the estimated total by the end of the cycle, with the amount still forecasted (here, $2,380.51, +$318.77 forecasted).
- Balance due — any outstanding balance; shows All paid when nothing is owed (here, $0.00 · All paid).
- Credits — account credit, applied to invoices automatically (here, $100.00 · Auto-applied).
- Inference usage — spend this period on the Inference API: requests, tokens, and the amount used against your inference credit (here, 6 requests · 8.2k tokens — $0.22 of $100.00).
- Payment method — the card on file (here, Visa ···· XXXX). Click Manage to update it.
Dollar amounts here are live values from your account (the figures in the screenshots are examples). For how charges are calculated, see How Billing Works.
Resource usage & limits
The Resource usage panel shows how much of each resource limit your account is using. The header calls out how many instances you're running against your cap (e.g. 38 / 60 instances) and how many VMs are idle, with shortcuts to Inspect virtual machines and Request limit increase.
Each row lists a resource with its usage / limit, a percent-used bar, a status, and a Request increase action:
| Column | What it shows |
|---|---|
| Resource | The tracked resource — Volumes, Memory, VMs, GPU, CPU, Storage, Public IPs, VPCs, Networks, Backups, and Backup Storage. |
| Usage | Current usage against the limit (e.g. 48 / 60 Volumes) with a progress bar. |
| Status | healthy (comfortably within the limit) or attention (approaching it). |
| Request increase | Opens a request to raise that resource's limit. |
Use this panel to spot what's filling up before it blocks new deployments — anything at attention is close to its cap. In Figure 2 (the WiLine Devops account), the header shows 15 VMs idle and 38 / 60 instances used; in the table, Volumes (48 / 60, 80%) and Memory (305 / 384 GB, 79%) are at attention, while VMs (38 / 60), GPU (3 / 5), CPU (152 / 256 vCPUs), and Storage (4,315 / 8,000 GB) are healthy.
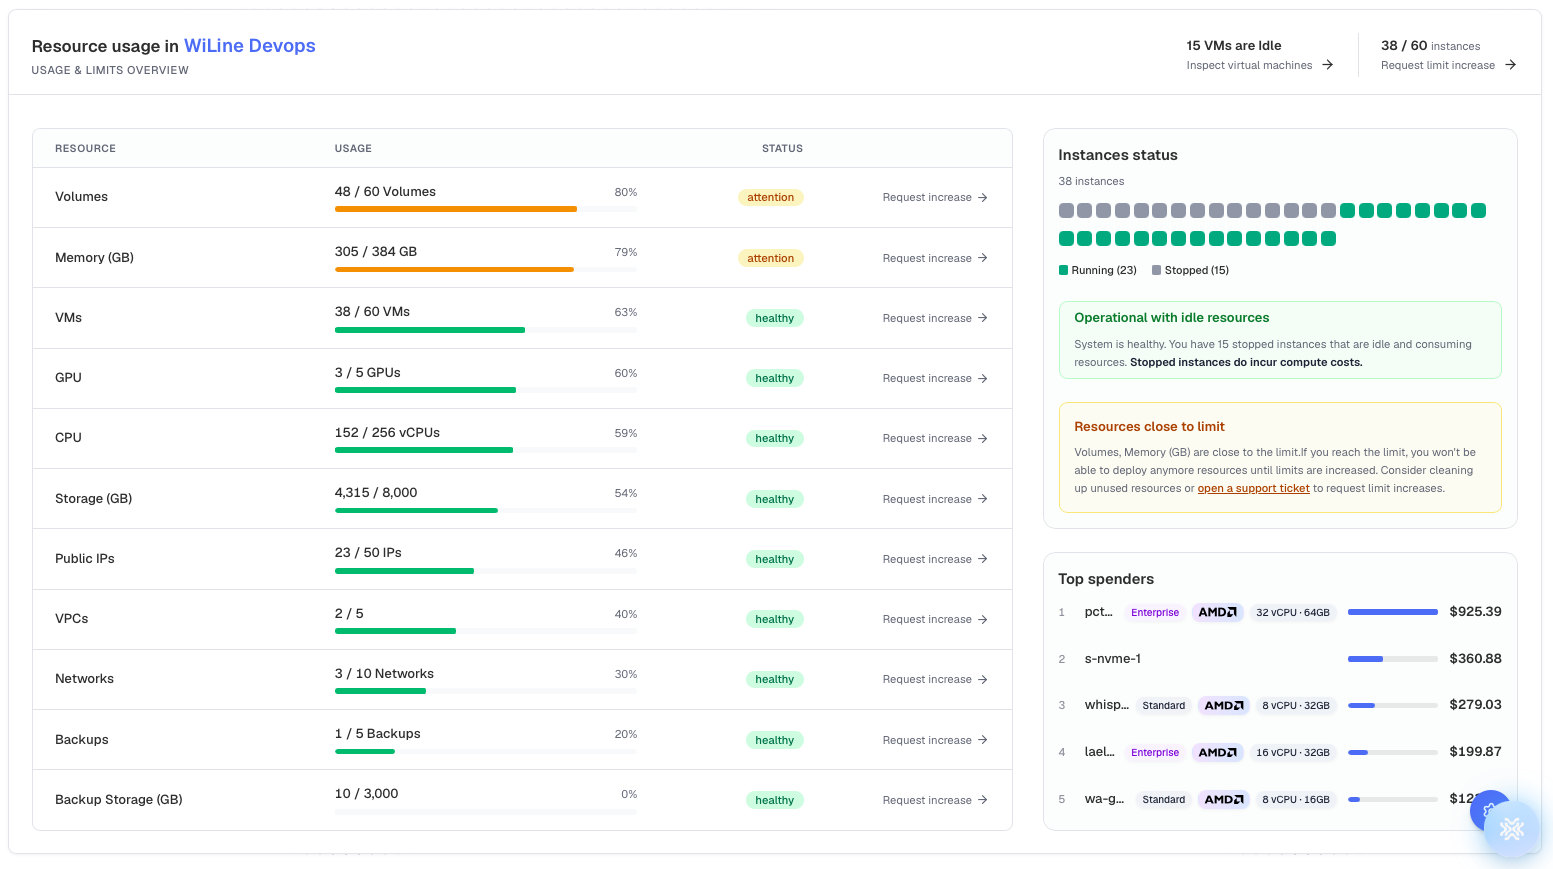
Figure 2. Resource usage and limits, with instance status and top spenders alongside.
Instance status
The Instances status panel shows every instance as a colored tile — Running (green) or Stopped (grey) — with a count of each, so you can see your fleet at a glance (in Figure 2, 38 instances — 23 Running, 15 Stopped). Below it, health callouts summarize what needs attention:
- Operational with idle resources — flags stopped, idle instances. Idle instances still hold provisioned resources and can keep incurring charges — see Stopped instances in the billing guide for exactly what a stopped instance is and isn't billed for.
- Resources close to limit — names the resources near their cap and recommends cleaning up unused resources or opening a support ticket to request a limit increase.
Top spenders
The Top spenders panel ranks the resources costing the most this period — showing the
instance type (e.g. Standard or Enterprise), its specs, and the amount spent — so
you can quickly see what's driving your bill and where to optimize. In Figure 2, the top
spender is an Enterprise, 32-vCPU instance at $925.39, followed by s-nvme-1 at
$360.88 and a Standard, 8-vCPU · 32 GB instance at $279.03.
Sidebar navigation
Use the search bar at the top to jump to any feature, or expand the menus below. Each item links to its documentation.
Platform
- Dashboard — this overview page
- Compute — virtual machines and related resources
- Storage — volumes, snapshots, backups, and buckets
- Networks — VPCs, subnets, IPs, and gateways
- VPCs — virtual private clouds
- Subnets — subnets within a VPC
- Elastic IPs — static public IPs
- VPN Gateways — secure VPN connectivity
- Network supervisor — monitor and manage networking
- Inference — the AI inference API
- Overview — quickstart and endpoint
- Playground — try models in the browser
- Models Hub — the model catalog
- API Keys — create and manage keys
- Examples — code snippets
Management
- Team Members — user access and permissions
- Events — system and activity logs
- Billing — usage, invoices, and payments
- Overview — current usage, balance, and recent invoices
- Cost Explorer — cost broken down by category and day
- Payment History — invoices, receipts, and credit transactions
- Payment Information — manage cards and coupons
- Tickets — support requests
- Account — profile, security, preferences, and account settings
Your account menu
Click your email in the sidebar to open your account menu:
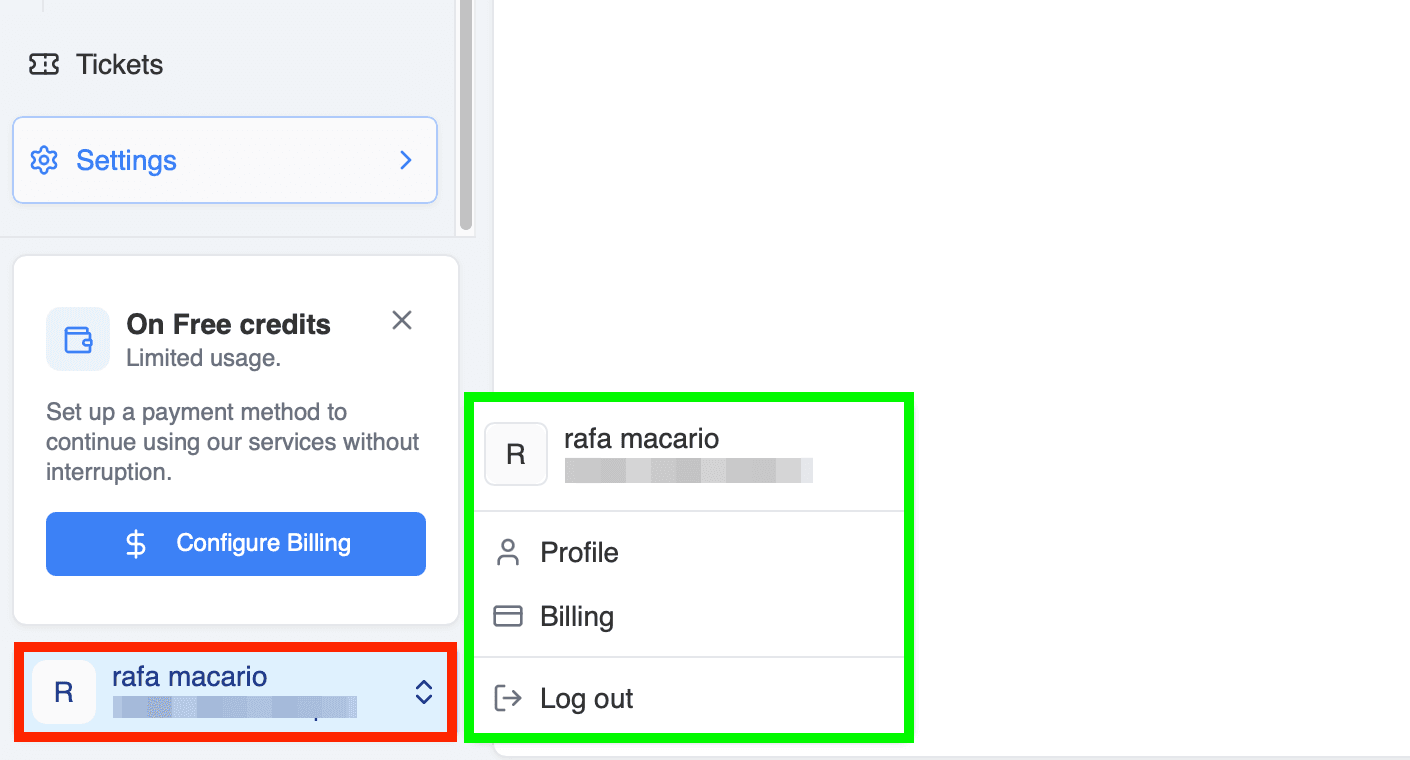
Figure 3. The account options menu.
- Profile: Manage personal information
- Billing: View and update billing details
- Logout: Sign out of your session
- If using free credits, follow the billing prompt to add a payment method
Profile settings
Click Profile to open your account settings. The General Information tab is selected by default.
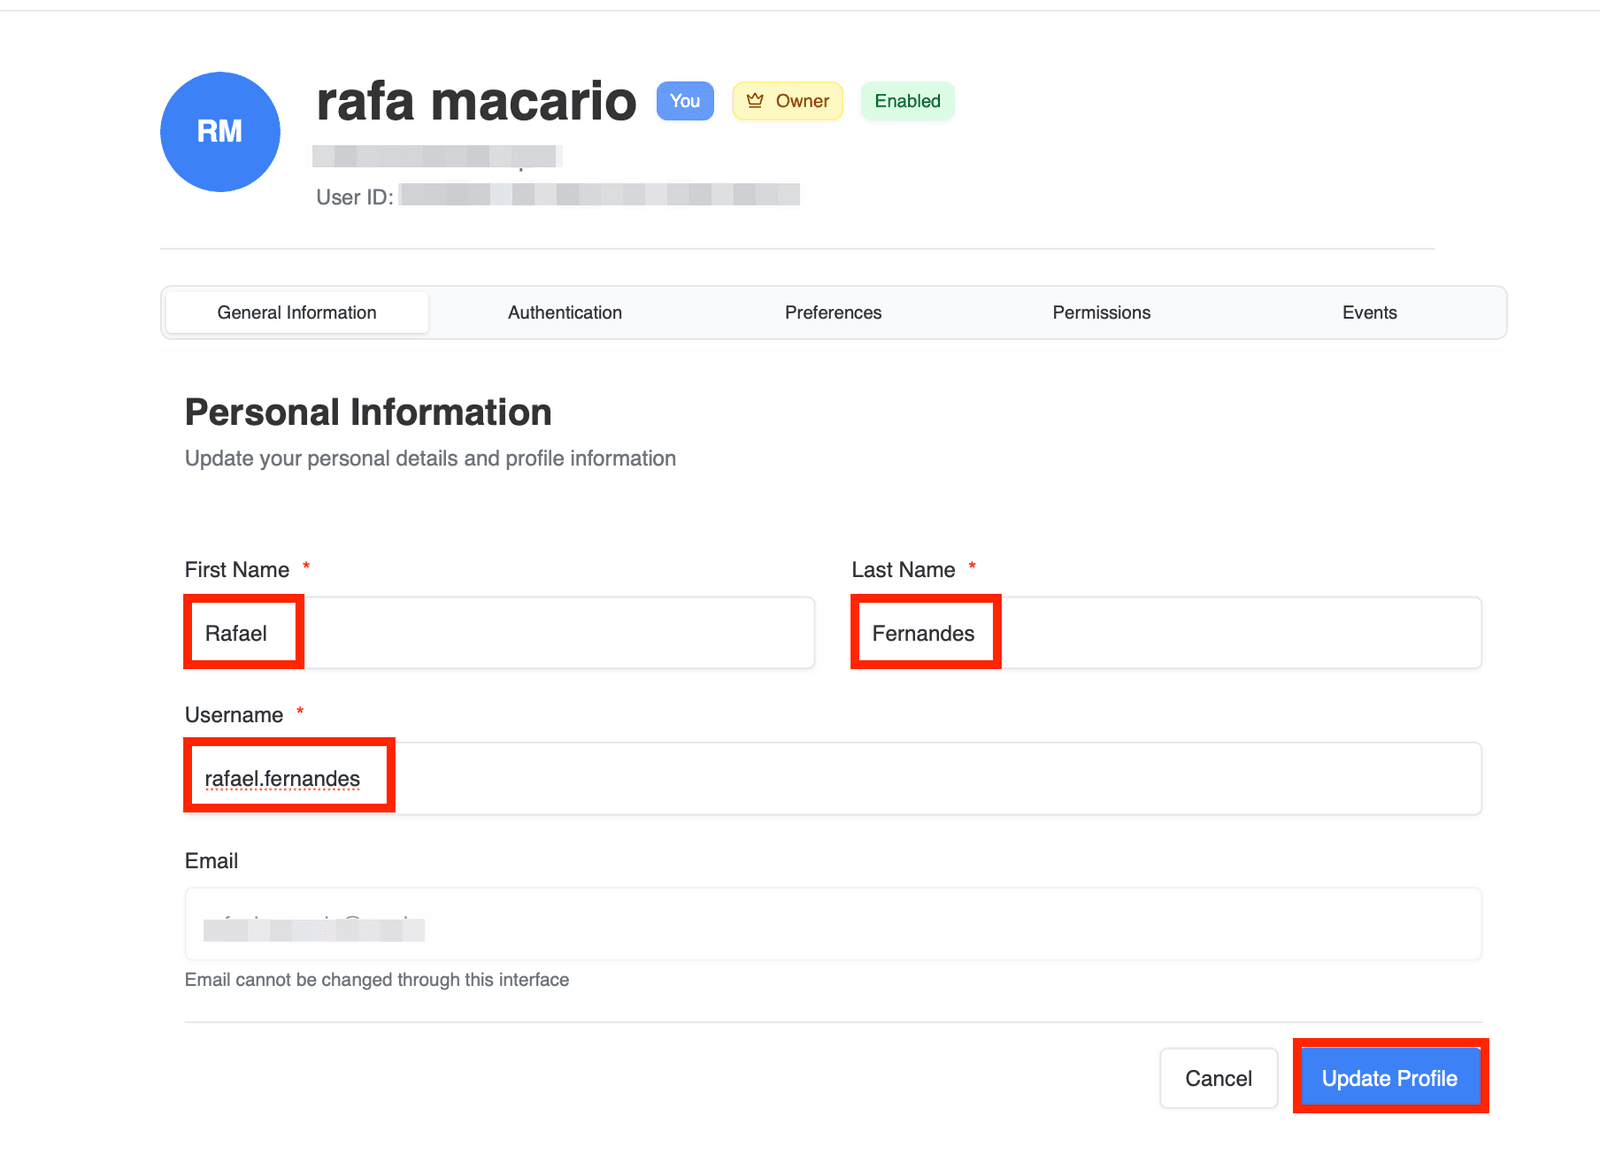
Figure 4. Profile settings (General Information).
- View and update your personal details — click Edit my profile to make changes.
- Your email address cannot be changed from this interface.
Authentication
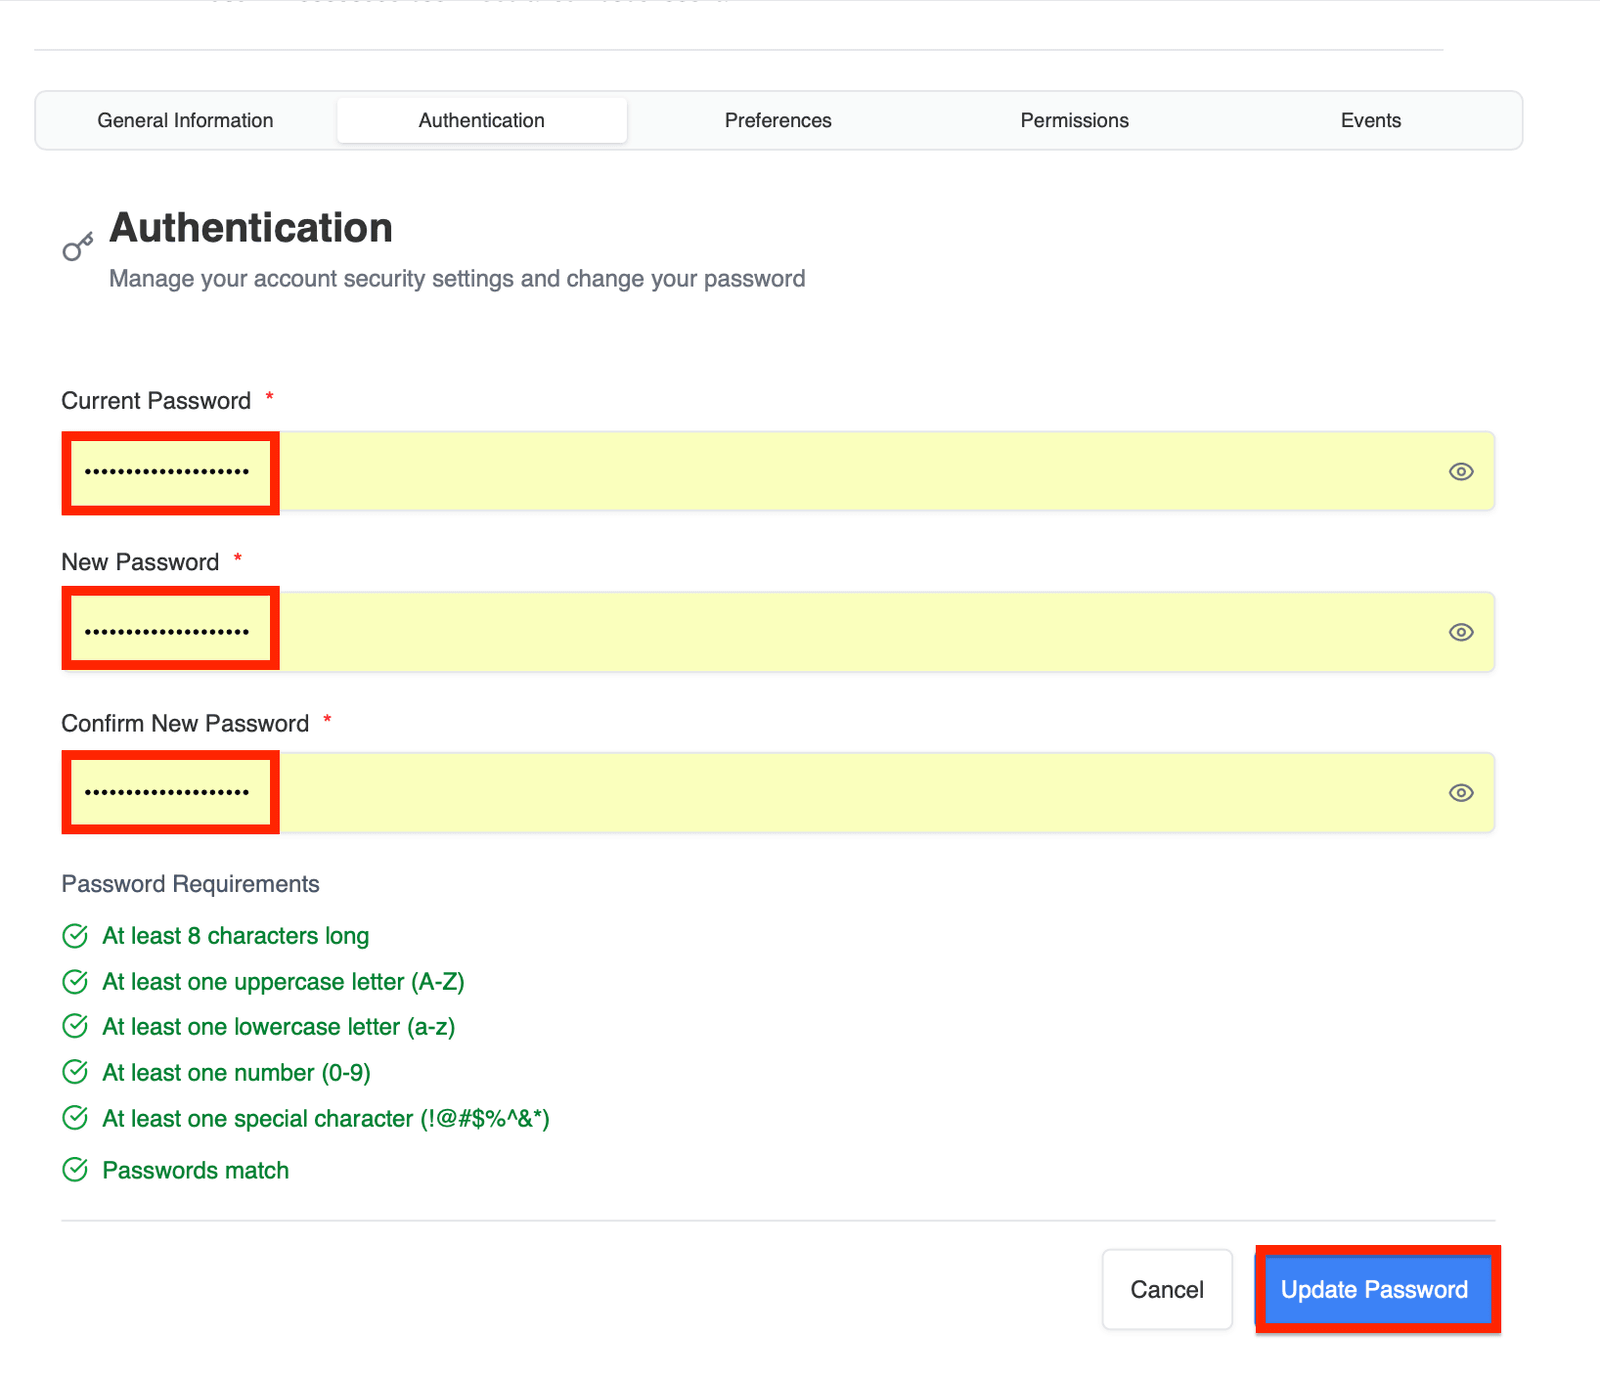
Figure 5. Change your account password.
Update your password by providing your current password, a new password, and a confirmation.
Preferences
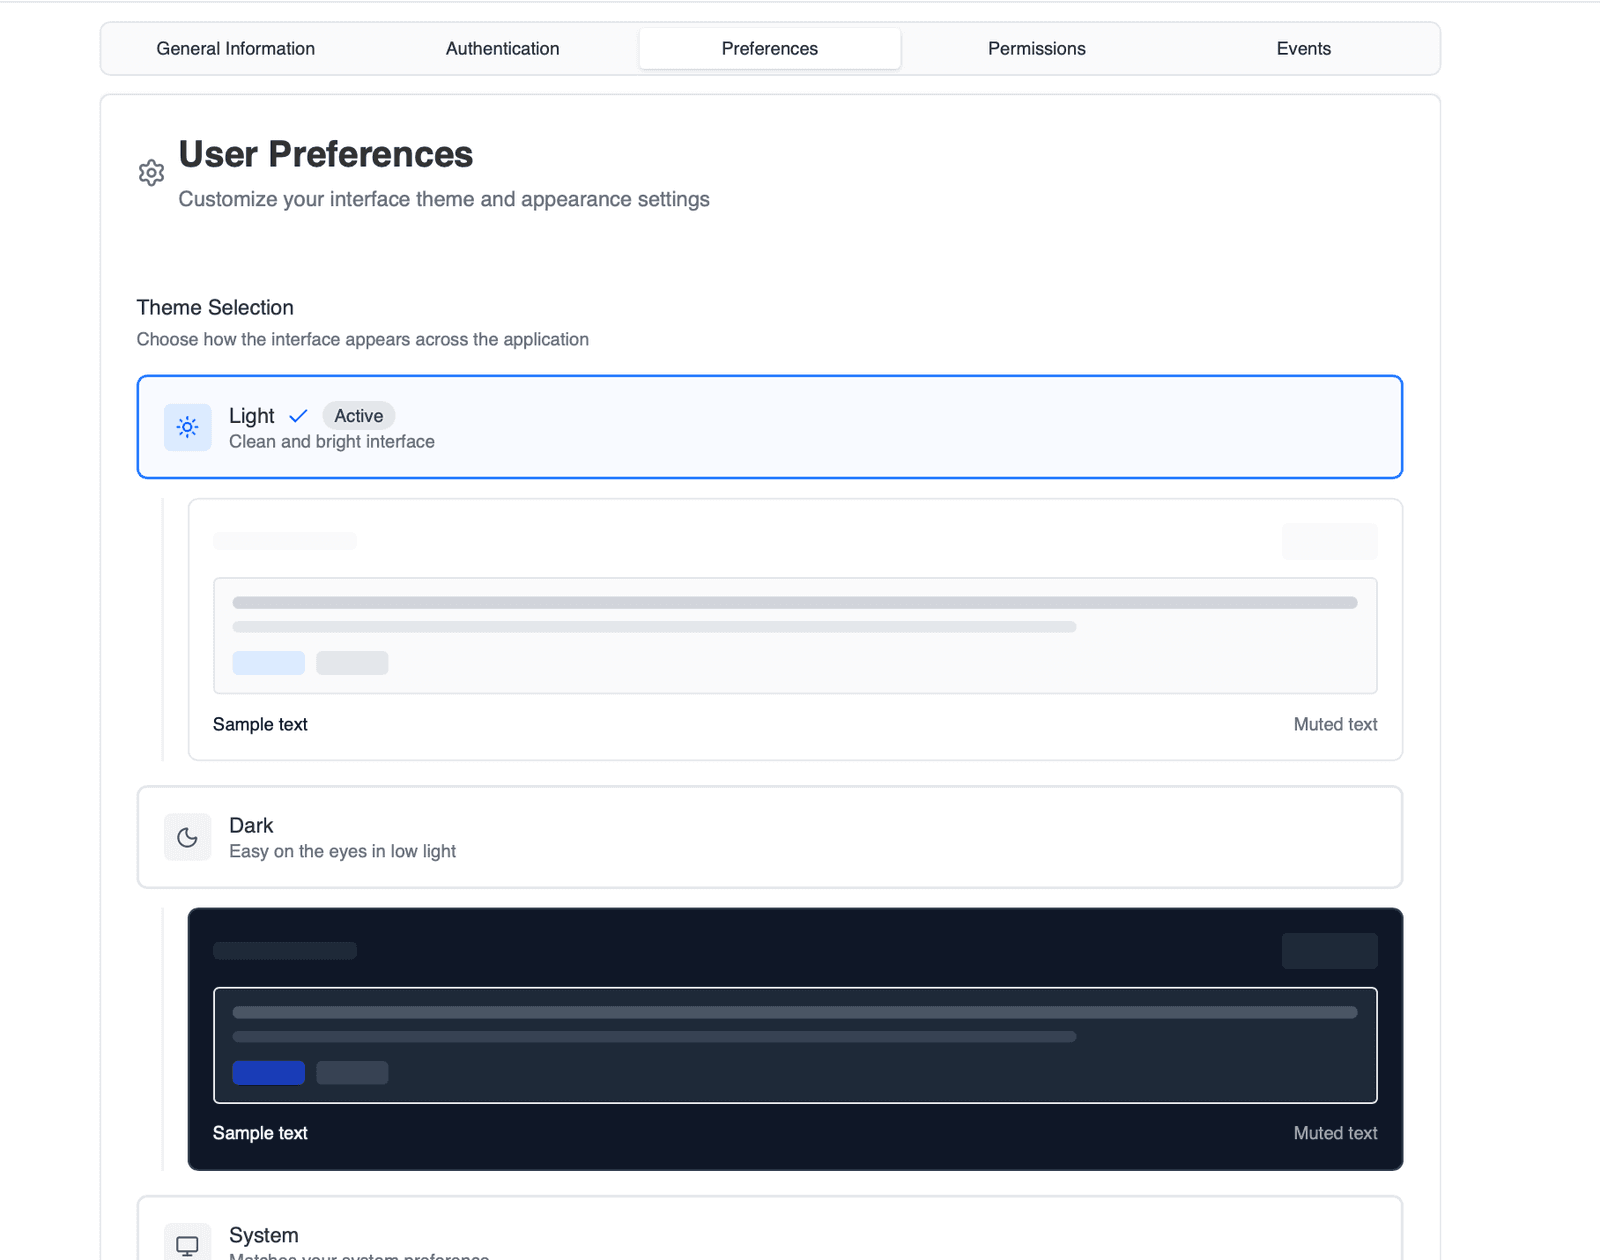
Figure 6. Customize interface preferences.
- Theme — Light, Dark, or System
- Sidebar — Open (expanded) or Collapsed (icon-only)
- Copilot display — Panel (docked right) or Bubble (floating button)
Permissions
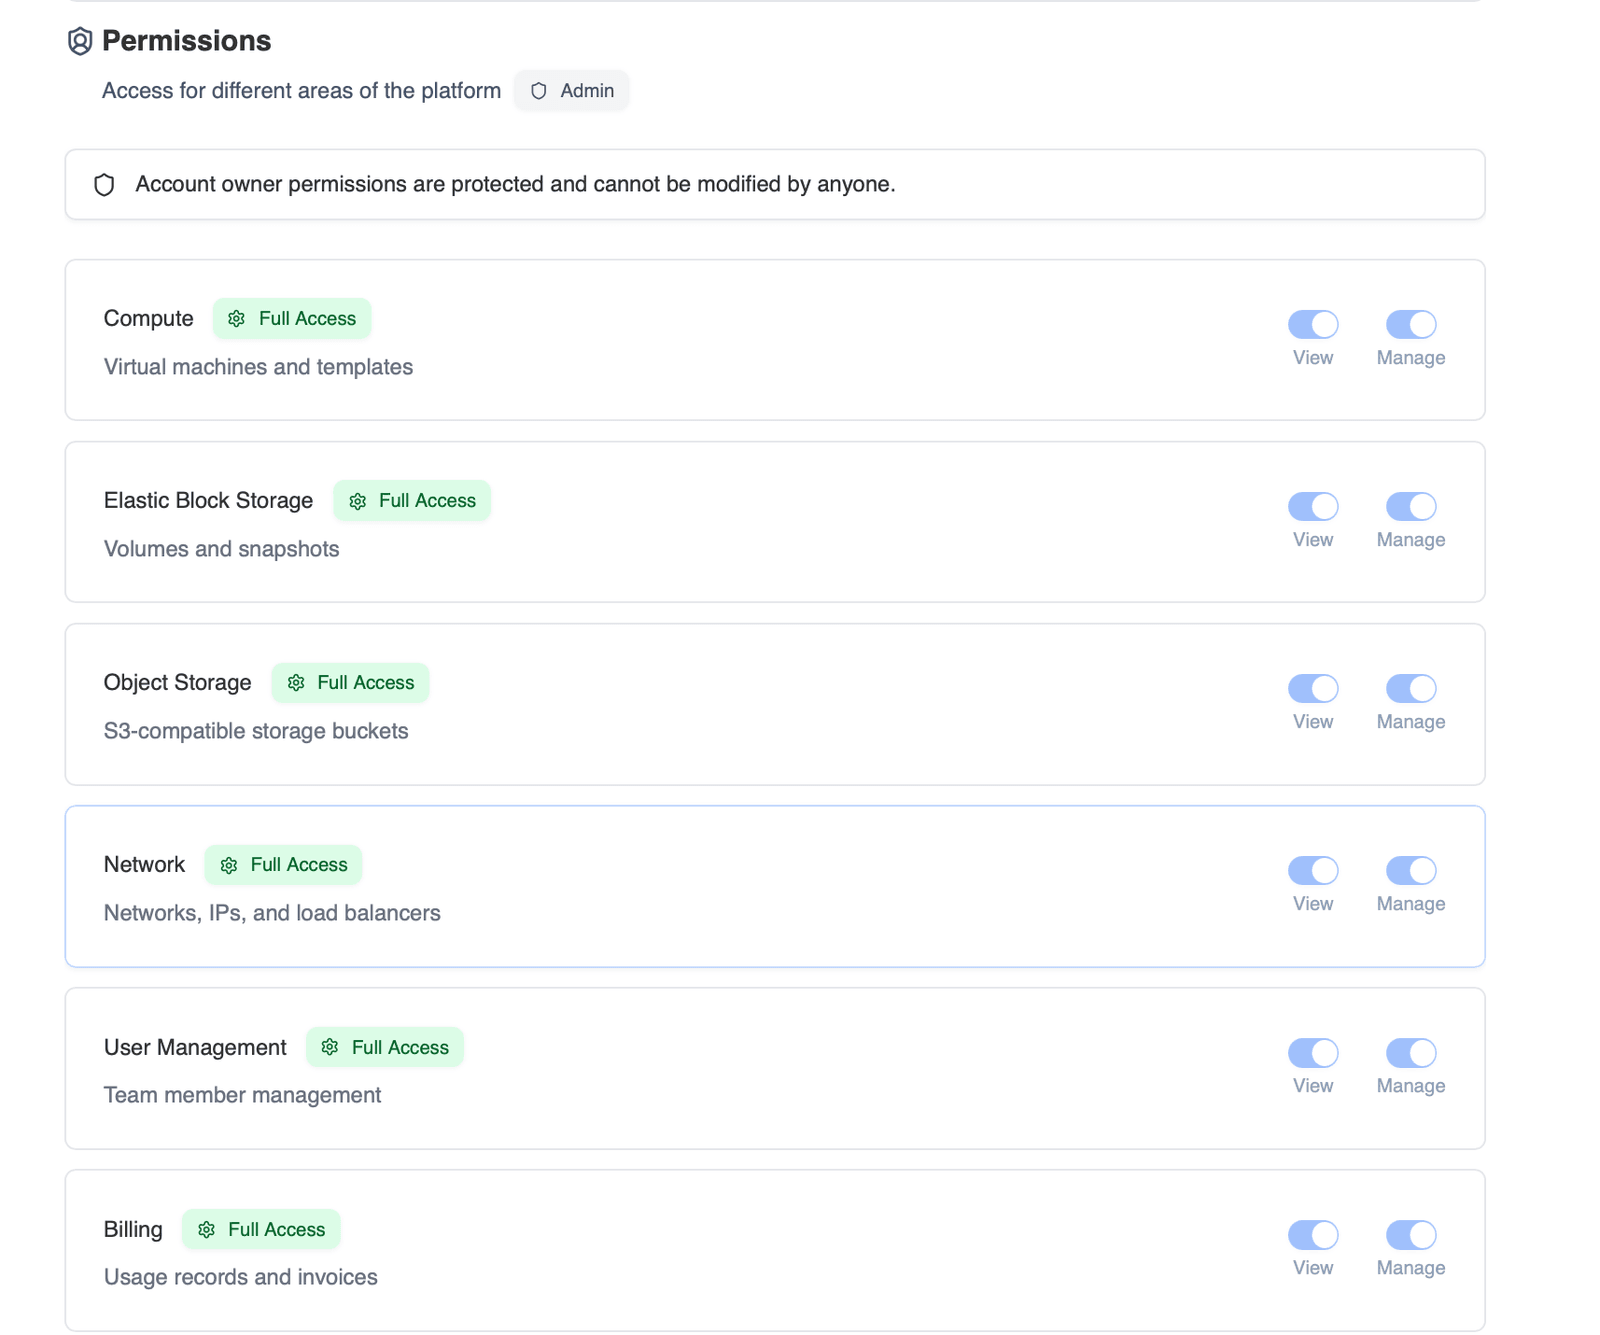
Figure 7. View access permissions across the platform.
Review your View and Manage access across Compute, Storage, Network, Billing, User Management, and Support.
Account owner permissions cannot be modified.
Events
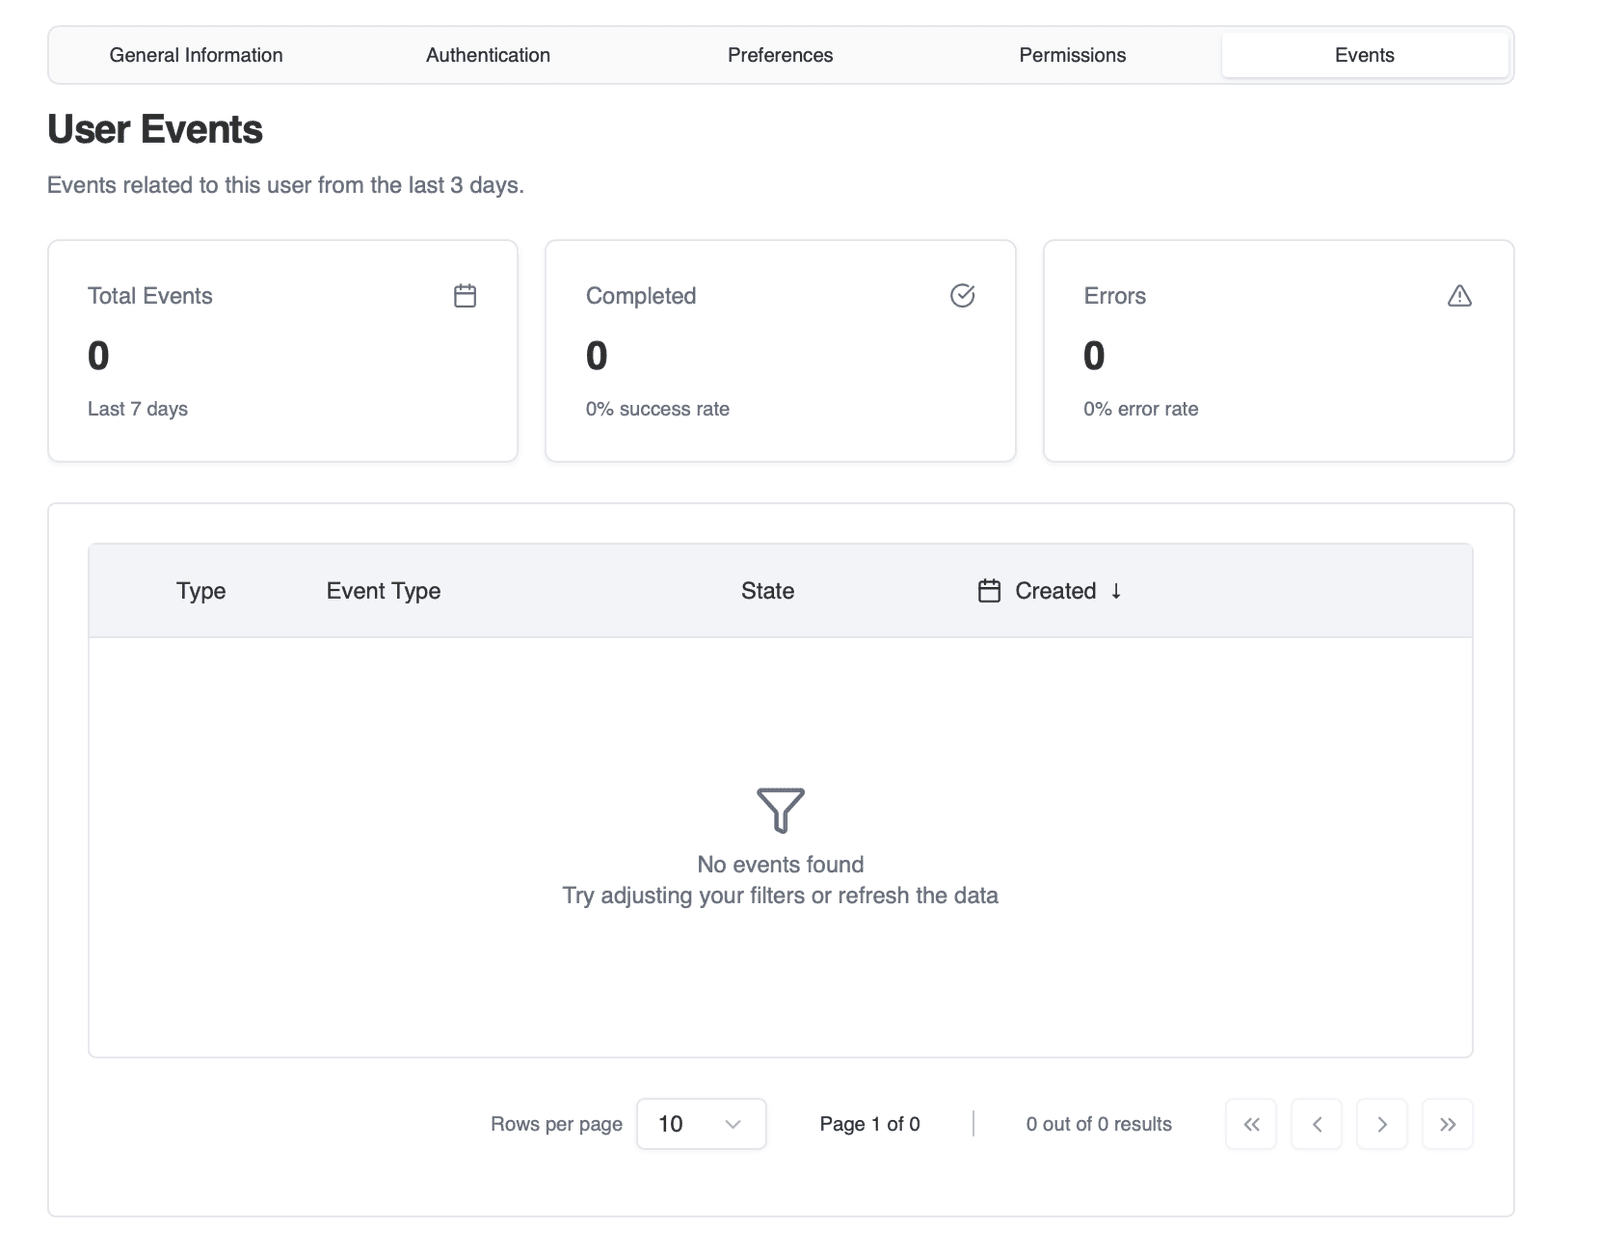
Figure 8. Activity and event history.
Review recent activity on your account — completed actions, errors, and system events — with filters and pagination.
Billing
Click Billing to open billing management.
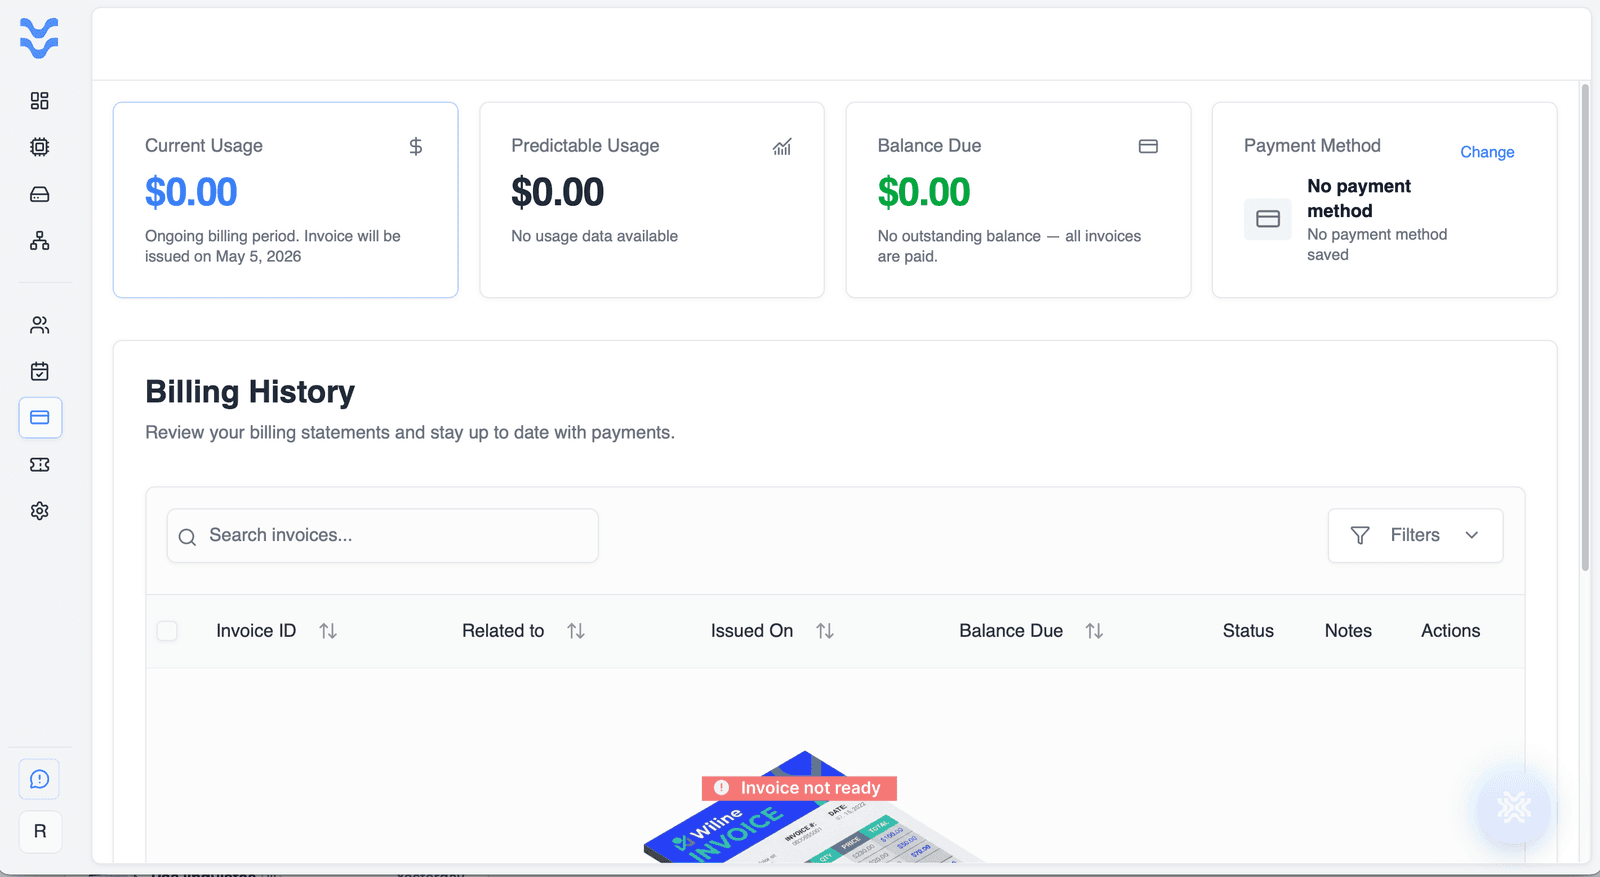
Figure 9. Billing and payment management.
- Current Usage — charges for the ongoing billing period
- Projected Total — estimated total by the end of the cycle, based on usage trends
- Balance Due — any outstanding balance (or confirmation that all invoices are paid)
For the full billing documentation — invoices, payment methods, coupons, and cost analysis — see the Billing section.
Logout
Click Logout to end your session securely; you'll be returned to the sign-in page.
WEC Copilot (AI assistant)
The Copilot panel in the bottom-right corner is an AI assistant for navigating and managing your environment.
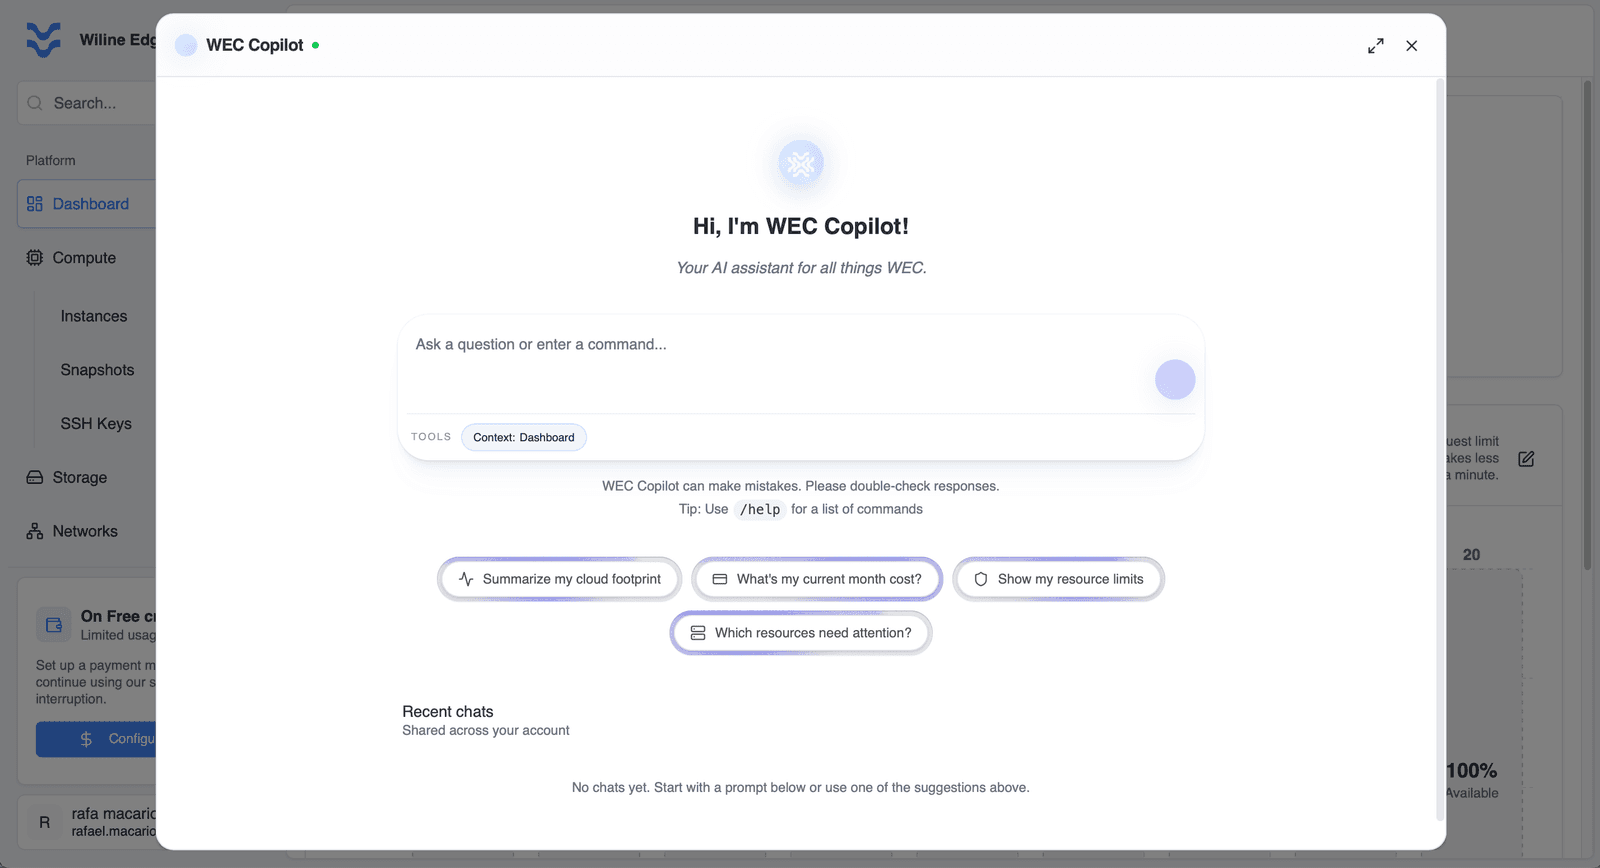
Figure 10. The WEC Copilot panel.
- Ask questions in natural language (e.g. “What's my current month cost?”)
- Summarize usage, performance, and costs; check billing, events, and tickets
- Use slash commands for quick actions:
/vms— list virtual machines/billing— current billing summary/events— recent platform events/metrics— VM performance summary/tickets— list support tickets
- Type
/helpto see all commands.
Copilot responses may not always be accurate. Always verify critical information manually.
Next steps
- Deploy a virtual machine — launch your first instance
- Inference API — call AI models over the API
- Billing — understand and manage your spend